Bitcoin at $66K: Why your BTC price predictions have been wrong lately
It was found that, historically, BTC price often moves in "the opposite direction of the crowd's expectation."

- BTC’s weighted sentiment has been negative for the past three weeks.
- Other on-chain indicators hint at the possibility of further price decline below $66,000.
As Bitcoin [BTC] extends its weekly loss by another 4%, its weighted sentiment continues on its bearish trend, according to Santiment’s data.
In a post on X (formerly Twitter), Santiment noted that BTC’s weighted sentiment has been negative for the past three weeks.
The beginning of this bearish trend, which occurred on 14th March, coincided with the coin’s price falling from its $73,750 all-time high. Exchanging hands at $66,572 at press time, BTC’s price has since fallen by 10%.
😱 The crowd's sentiment toward #Bitcoin and #crypto markets in general has wavered ever since the big correction 3 weeks ago. Even with the $BTC halving now just 2 weeks away, trader sentiment reflects #FUD and #bearish expectations.
With prices bouncing back to $69K… pic.twitter.com/DYs5RYNR95
— Santiment (@santimentfeed) April 5, 2024
Using historical precedents, Santiment added that BTC’s price often “move (in) the opposite direction of the crowd’s expectation.”
During periods when the market reaches euphoric highs and expects a continued rally, BTC’s price retraces. Conversely, when sentiment grows poor and the market expects further downside, BTC’s price has been known to initiate an uptrend.
This pattern has played out even in recent times.
More decline in the short term?
On 4th April, BTC’s price rallied above the $69,000 price level briefly before retracing to the $66,500 region. With new resistance formed at $69,000, on-chain data suggests the possibility of a further decline in the leading crypto’s value in the short term.
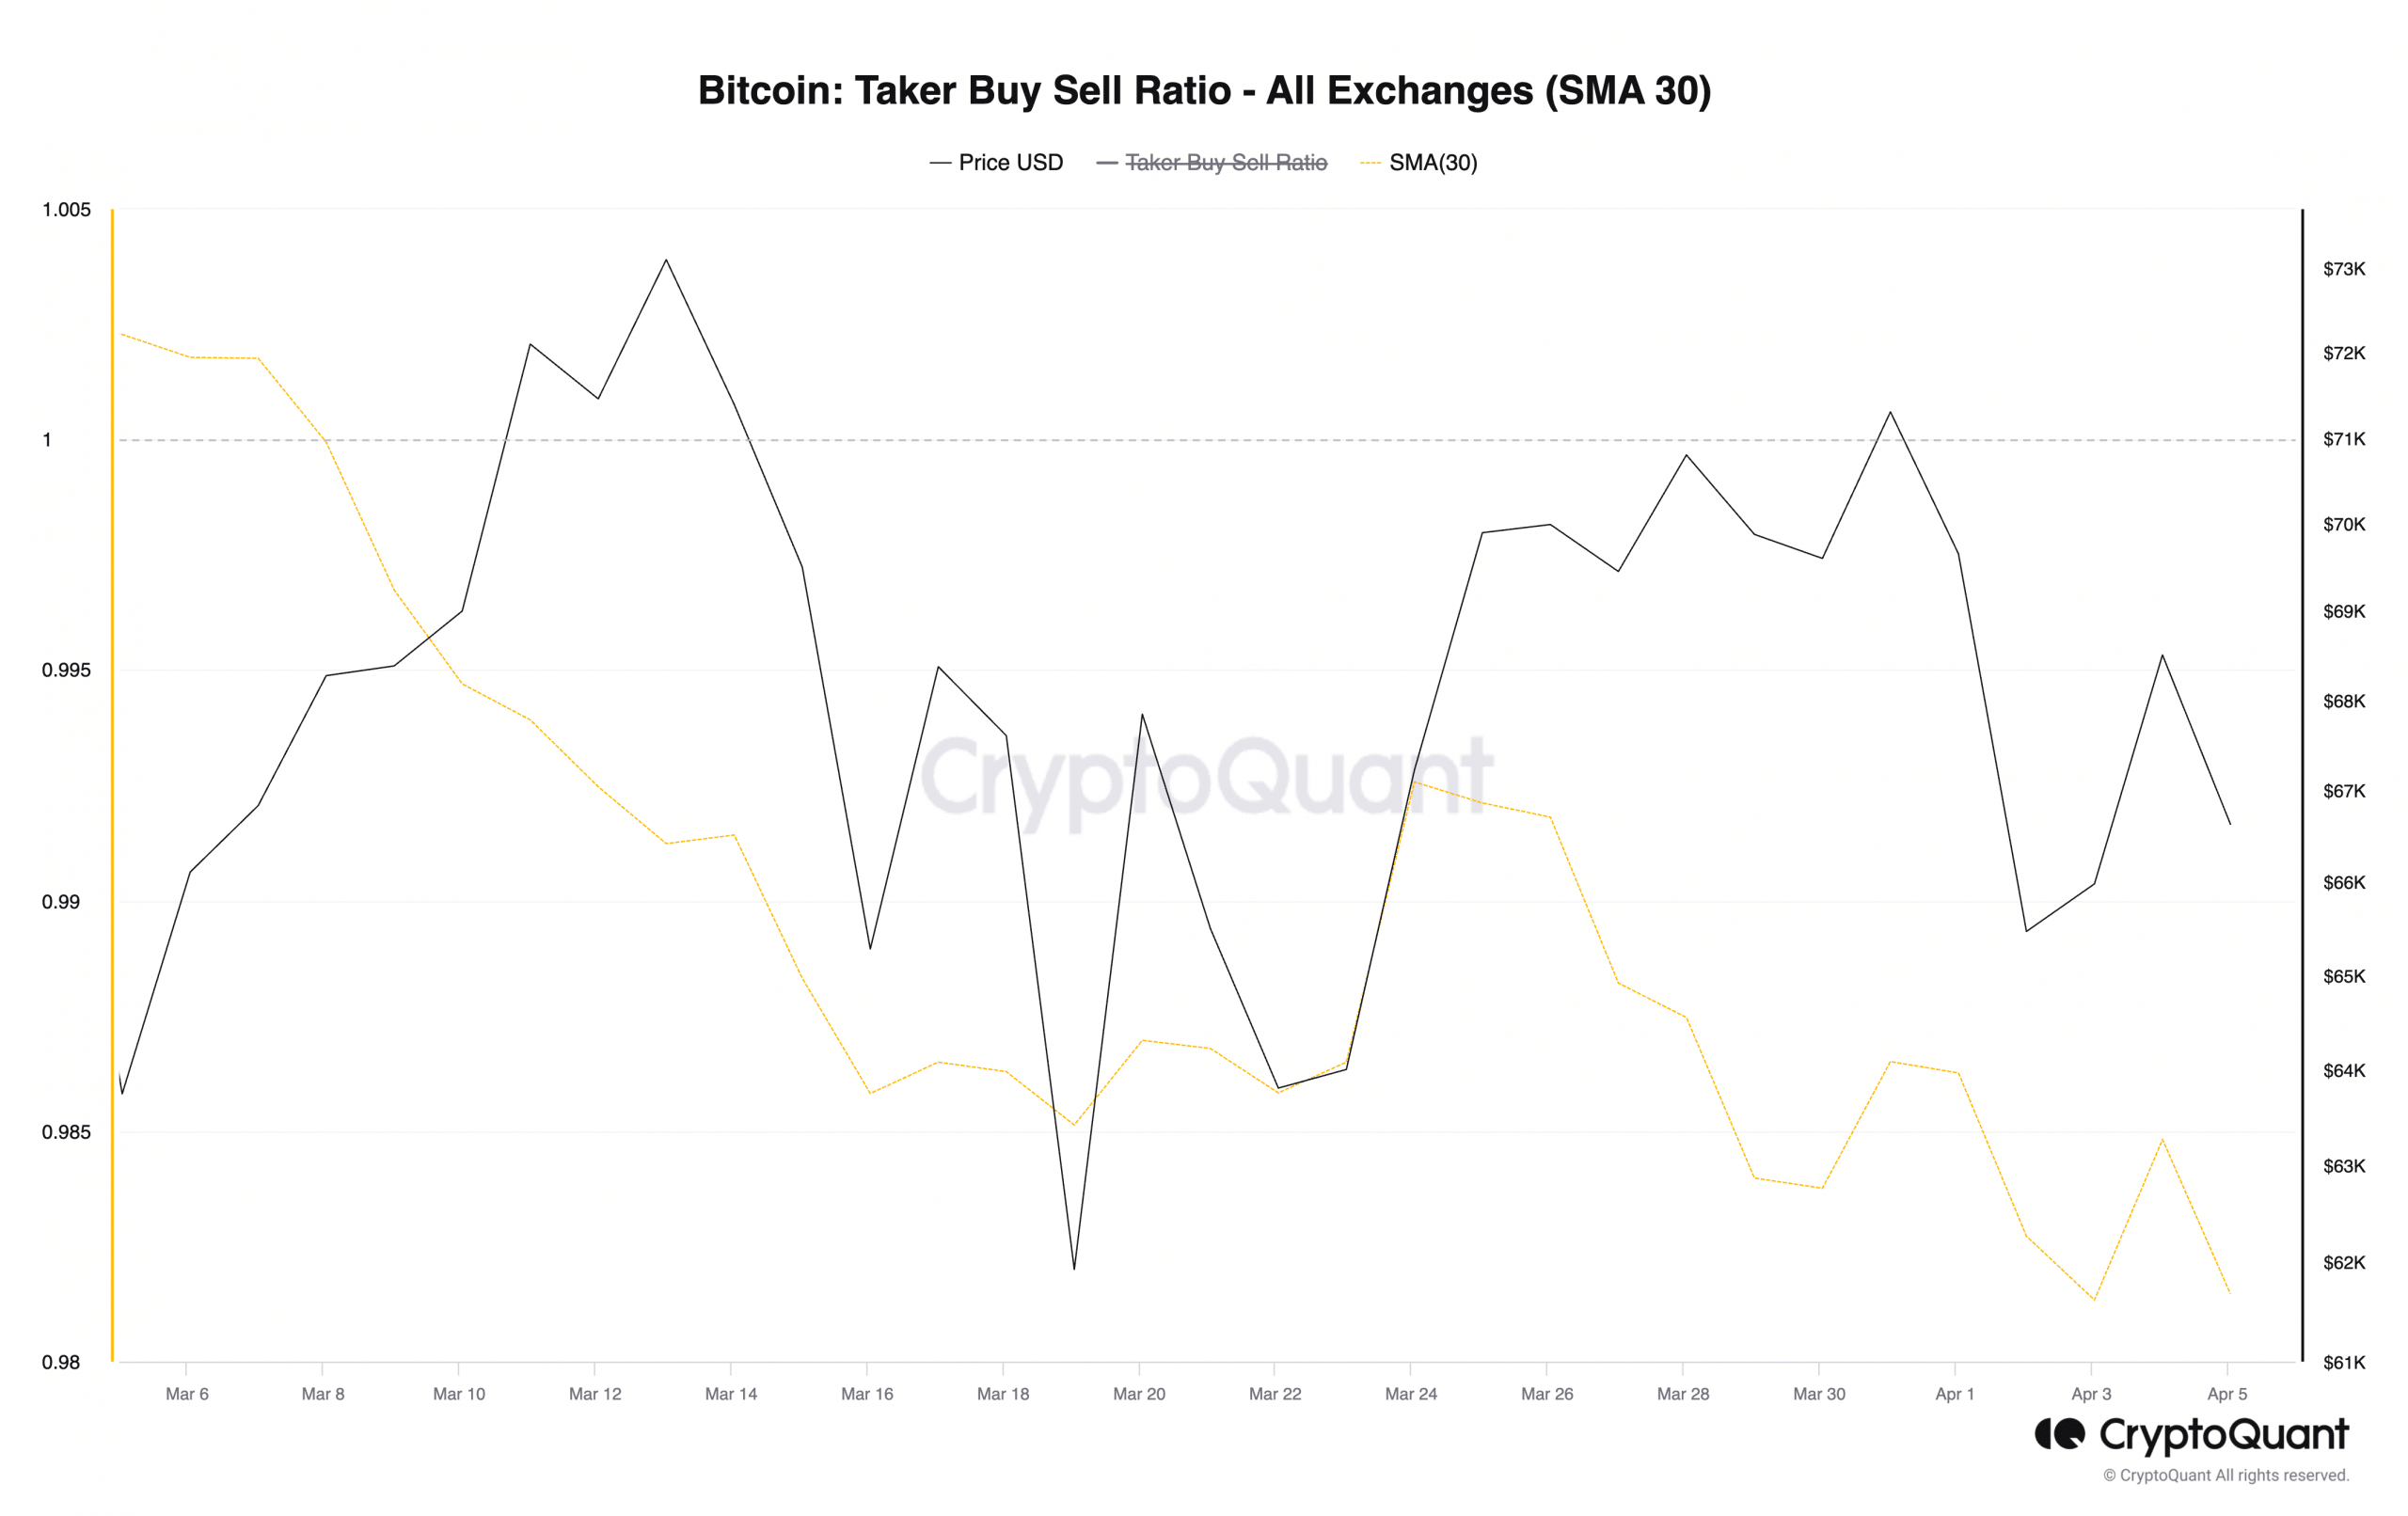
Firstly, the coin’s taker buy-sell ratio assessed on a 30-day simple moving average (SMA) fell below the zero line on 8th March, foreshadowing the price decline that commenced on 14th March.
The taker buy-sell ratio is a metric that measures the ratio between the buy volume and sell volume in an asset’s futures market. A value greater than 1 indicates more buy volume than sell volume, while a value less than 1 indicates more sell volume than buy volume.
Since 8th March, the value of BTC’s taker buy-sell ratio has been less than 1. The steady decline in this metric means that there are more sellers than buyers among those executing immediate trades in the BTC market.
This is expected to continue as long as sentiment remains bearish, putting downward pressure on the coin’s price.
Further, in a recent report, pseudonymous CryptoQuant analyst Tugbachain found that BTC’s NVT Golden Cross closed March flashing a sell signal.
This indicator compares the 30-day moving average of the coin’s network value to transactions (NVT) ratio with its 10-day moving average.
Read Bitcoin’s [BTC] Price Prediction 2024-25
It generates a long signal when it returns a value less than 1.6. Conversely, when the value is above 2.2, it is taken as a signal to enter short positions.
According to Tugbachain:
“At the end of March, with the Bitcoin price around $71,000, the NVT value reaching ‘3.17’ levels served as an indicator of reaching a local peak.”