Bitcoin [BTC]: A tale of how short traders caused a price rally in January
![Bitcoin [BTC]: A tale of how short traders caused a price rally in January](https://ambcrypto.com/wp-content/uploads/2023/01/1674497946922-5081218e-54e9-4762-83a2-bd718a5de68b-3072.jpg)
- BTC saw a huge number of short trader liquidations in the last month, hence the price rally.
- With waning buying pressure, BTC’s price might soon suffer a correction.
In January 2023, Bitcoin [BTC] markets experienced their strongest monthly performance since October 2021, with a year-to-date (YTD) increase of over 43%. Glassnode, in a new report, found that this unexpected spike in value put BTC’s price at its highest level since August 2022, with a weekly increase of 6.6% from its low of $22,400.
How much are 1,10,100 BTCs worth today?
Whodunit: Unpacking the mystery of Bitcoin’s rally
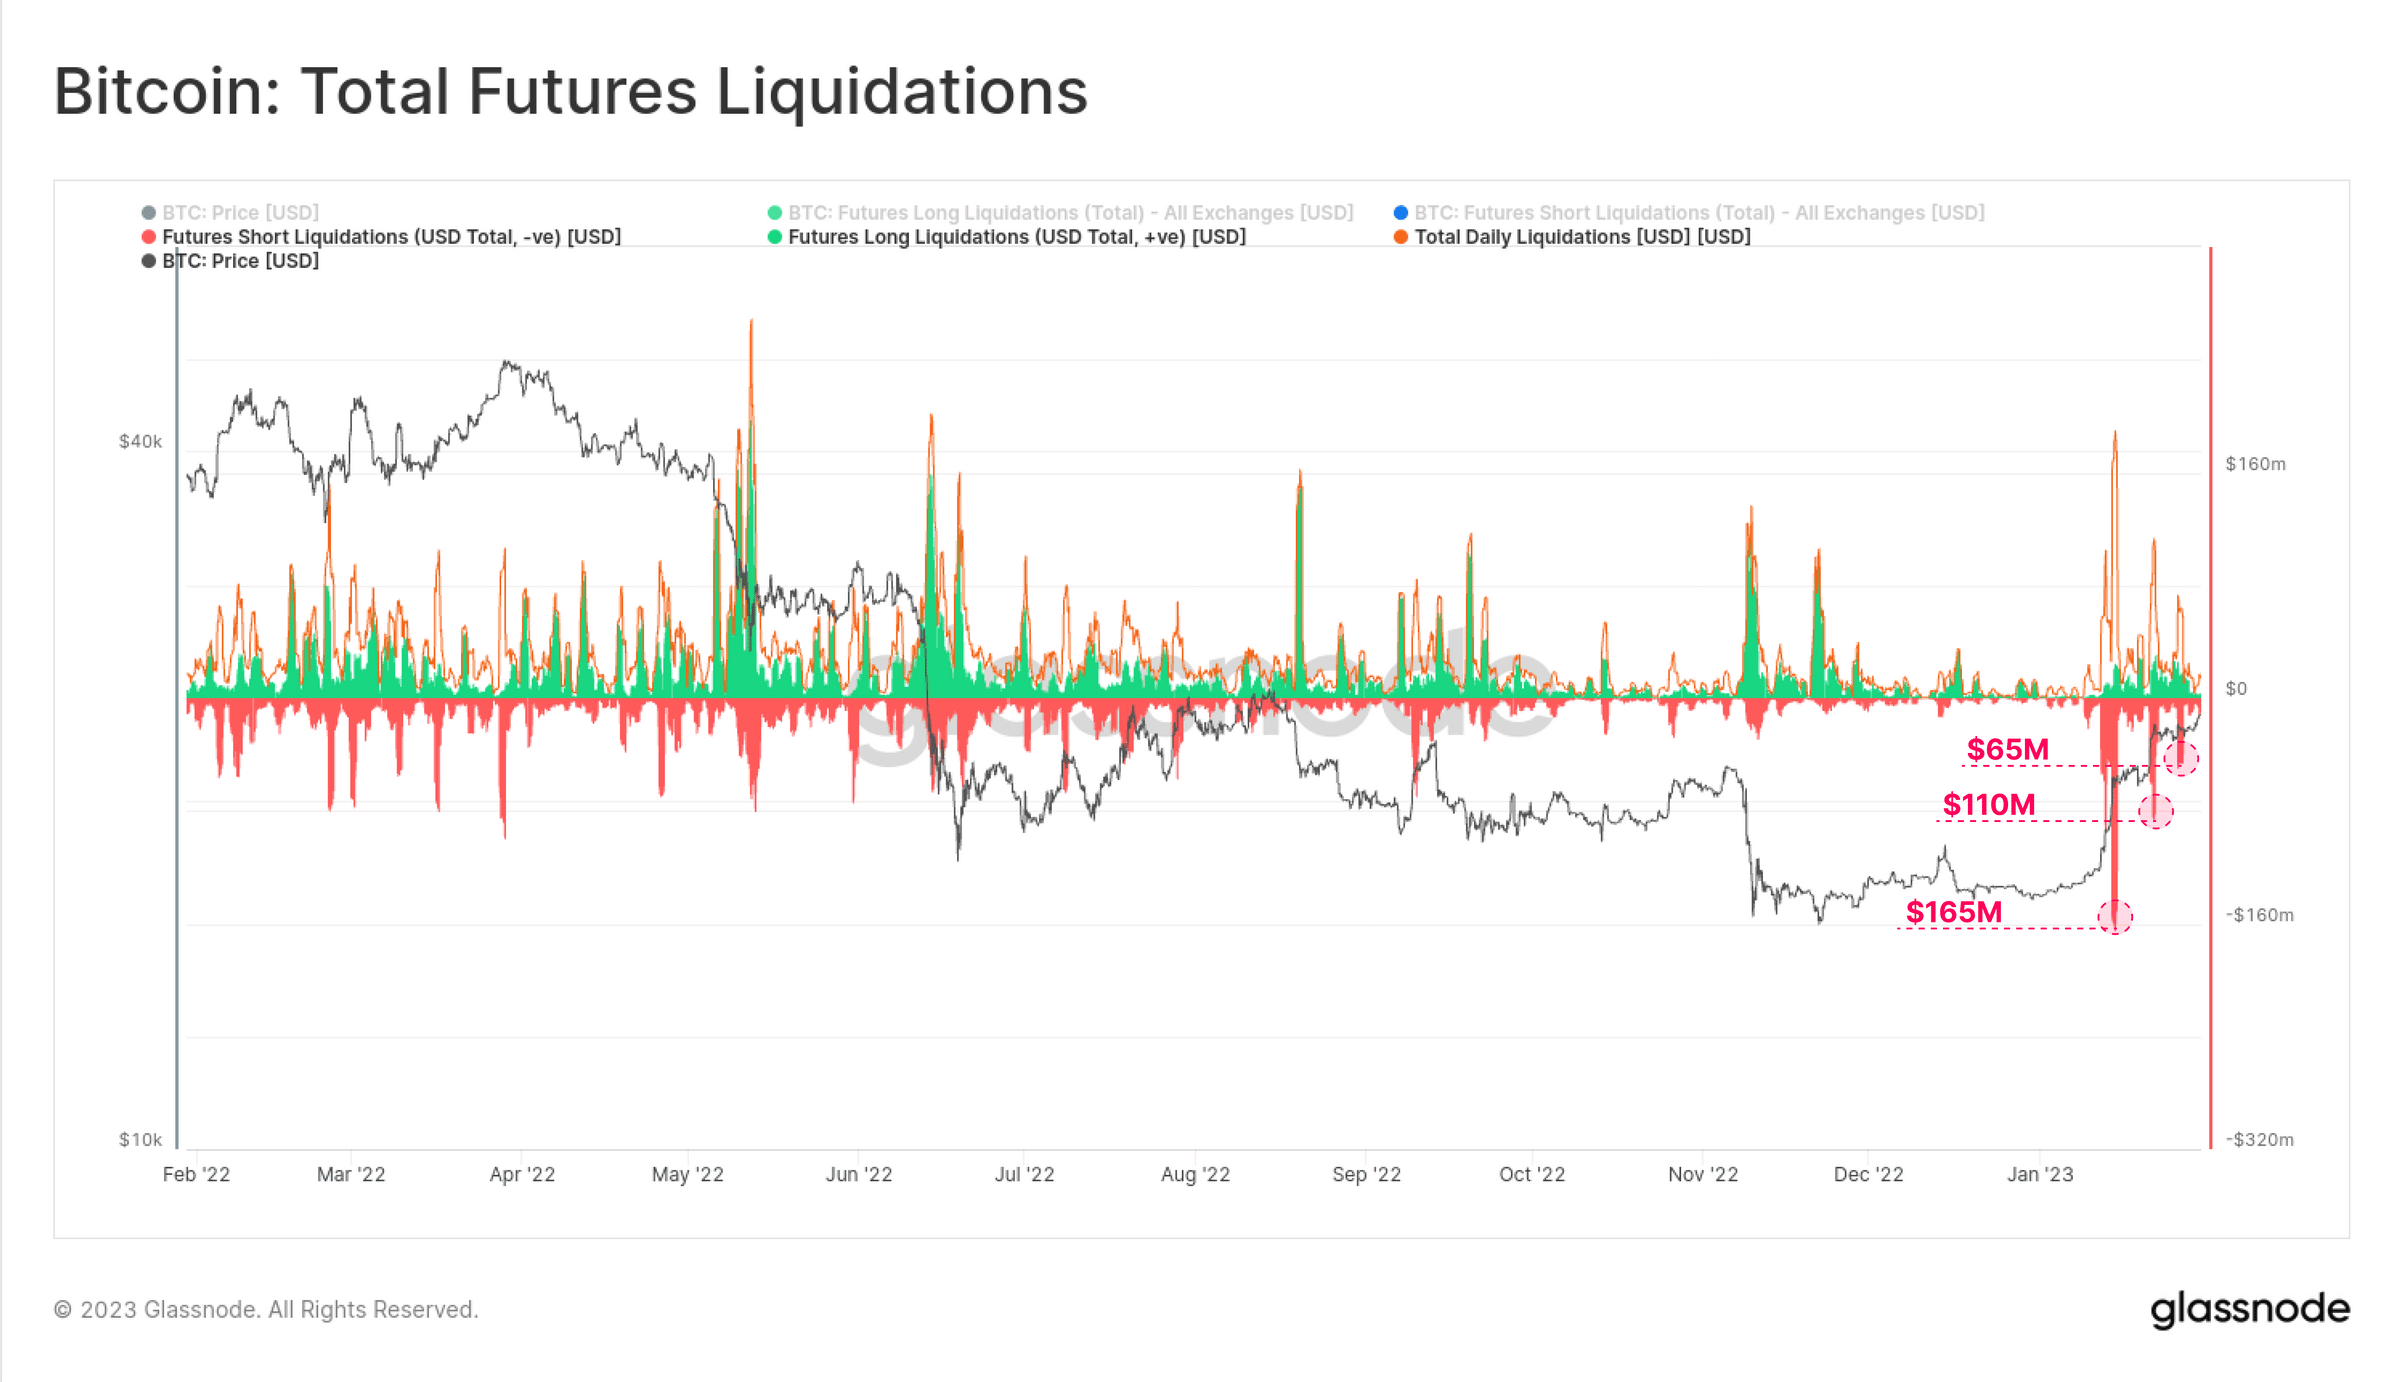
Glassnode reported that an increase in the number of short squeezes in the derivatives market was the main reason behind the recent surge in BTC’s price over the past month. The recent rally was driven by short squeezes in the derivatives market, with over $495 million in short futures contracts liquidated in three waves.
The report noted that the cash and carry basis for perpetual swap and calendar futures were now in positive territory, indicating a return of positive sentiment and speculation in the market.
Although the total Open Interest in BTC, in relation to its market capitalization, has declined since November 2022, and the leverage ratio has dropped from 40% to 25%, Glassnode opined that this represented a decrease in futures leverage and short-term speculative interests.
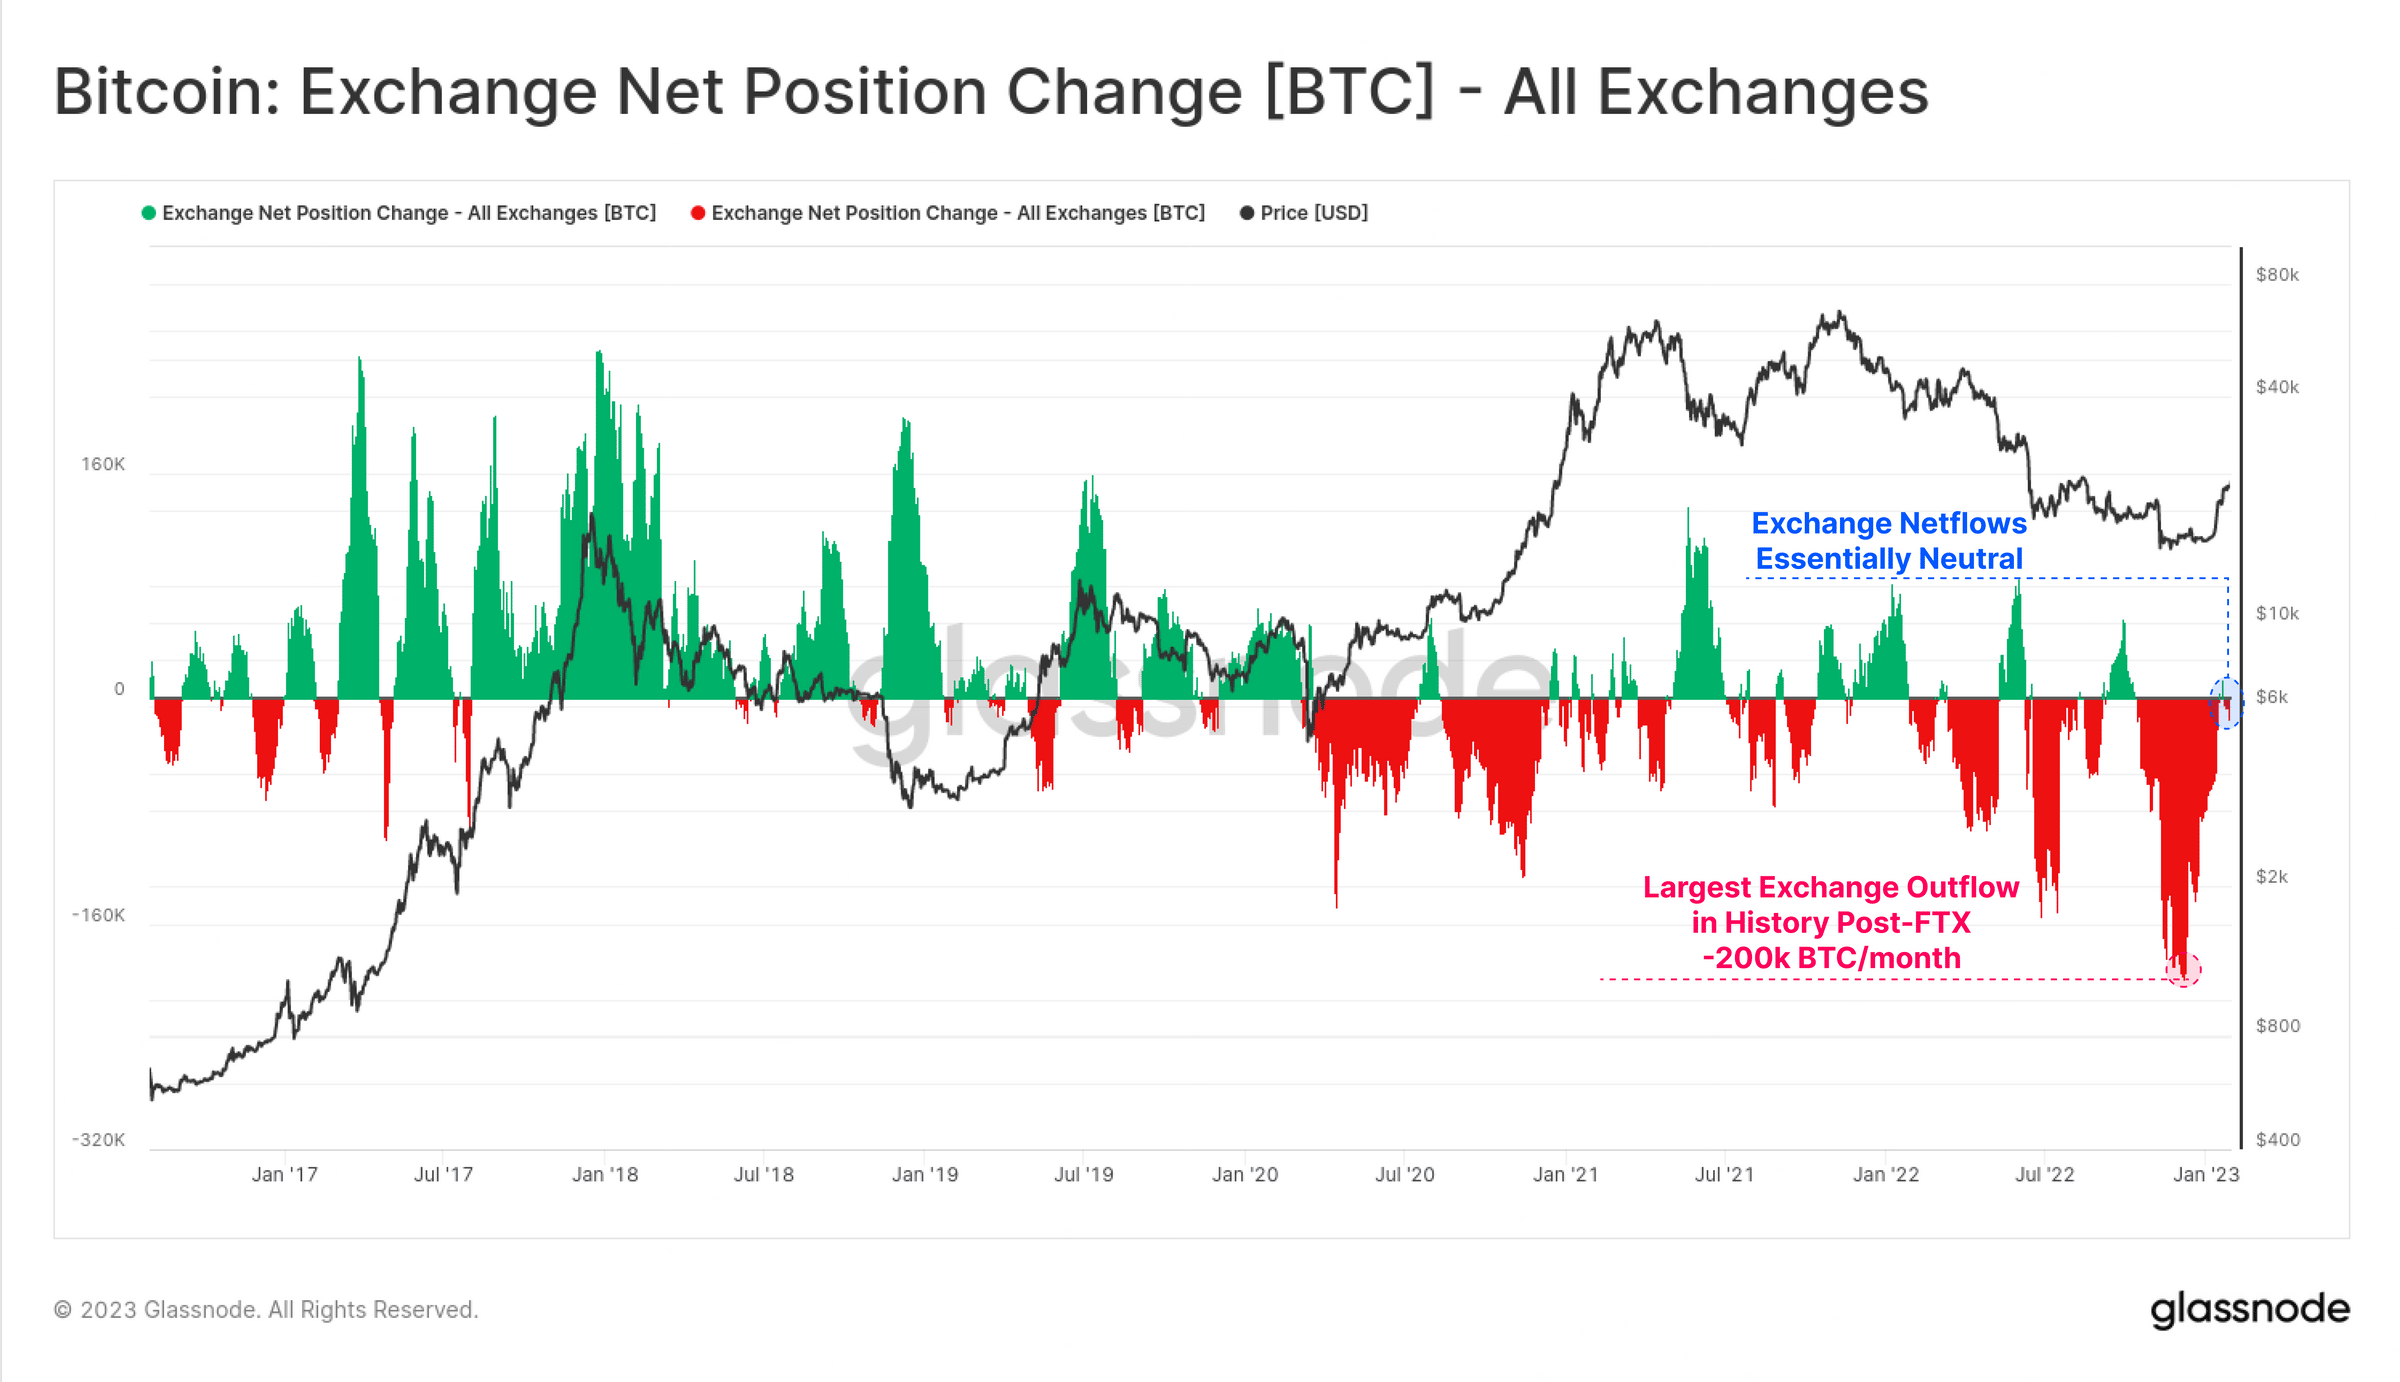
Further, Glassnode found that as price rallied in the last month, new demand for the king coin slowed. According to the report, the total BTC balance held on exchanges has reached a multi-year low of 11.7% of the circulating supply.
The daily inflow and outflow of coins from exchanges was balanced, with a net flow of $20 million, reflecting a slowdown in new demand. The largest monthly outflow of coins in history occurred from November to December 2022 but has returned to neutral, indicating a cooling down of outflows.
The upward trend of BTC may come to a halt
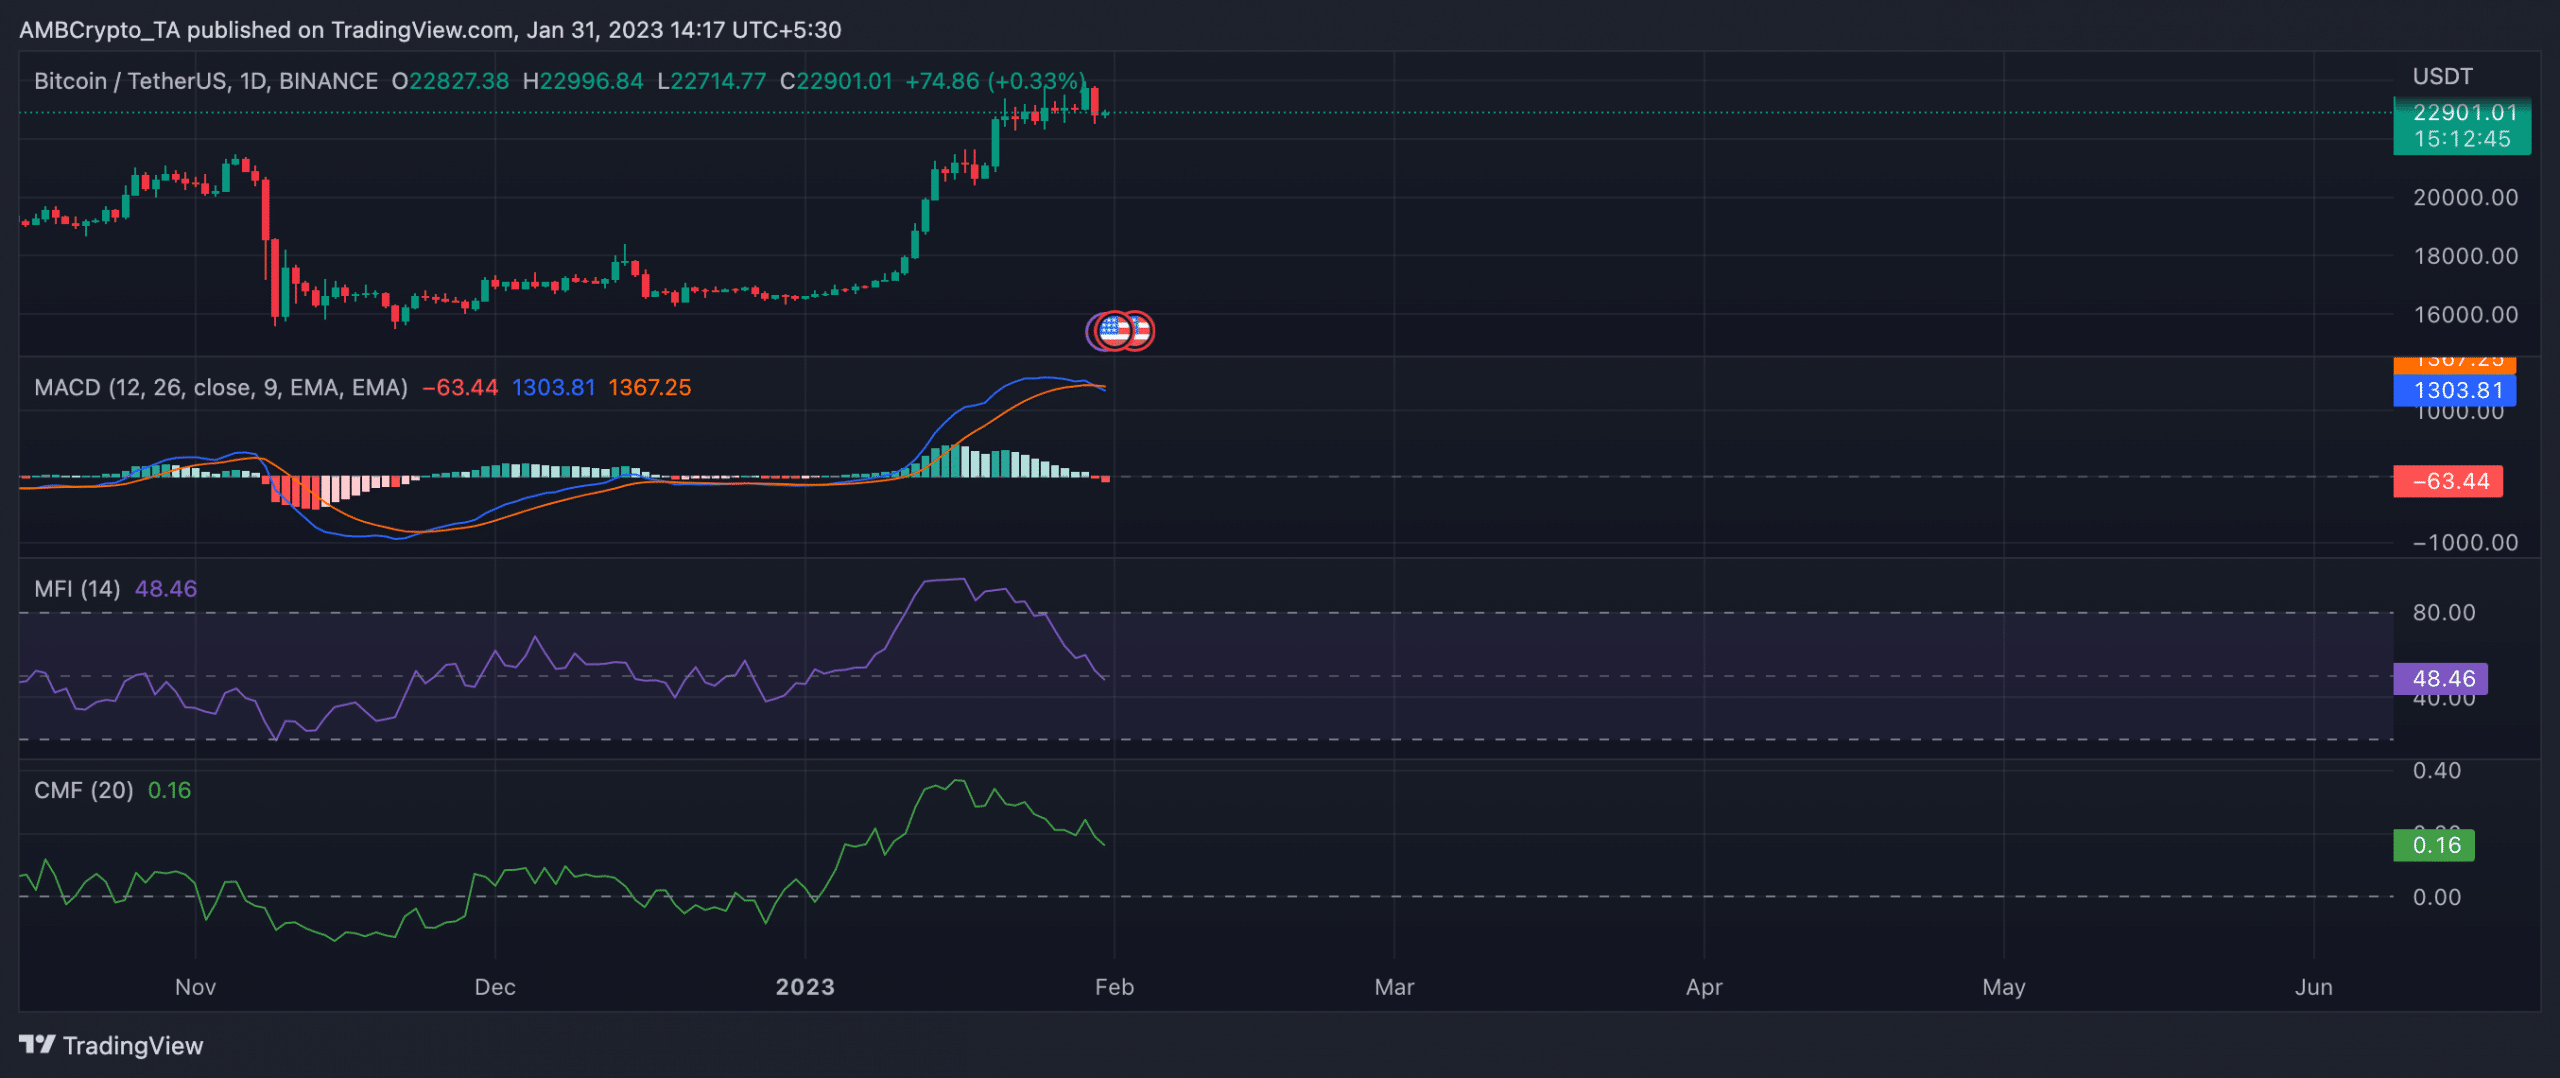
BTC’s movements on a daily chart suggested that its price might experience a drawback in the new trading month. As of this writing, the leading coin’s moving average convergence/divergence (MACD) indicator revealed that a new bear cycle had commenced. The MACD line had intersected the trend line in a downtrend, and BTC’s price fell to its 21 January level.
Furthermore, the coin’s price and Chaikin Money Flow had moved in opposite directions in the past two weeks, creating a bearish divergence.
Is your portfolio green? Check out the Bitcoin Profit Calculator
This bearish divergence indicated that there might be a potential price fall in February, as the trend in the CMF suggested a decrease in buying pressure while the price continued to move upwards. This is a red flag for investors, as it may indicate that the upward trend in price is not supported by underlying demand.
Lastly, BTC’s Money Flow Index (MFI) was 48.46 and was in a downtrend at press time, having breached the 50-neutral spot. This also showed that buying momentum had declined significantly in the BTC markets.