Bitcoin became a practical reality in 2009. However, as an idea, it’s been around for a while.

In fact, David Chaum, an American cryptographer, once proposed eCash – A revolutionary idea of electronic money. Building on this idea, he launched Digicash in 1989. However, it failed to gather notable adoption. 

Decades later, Satoshi Nakamoto published the Bitcoin whitepaper and described the peer-to-peer electronic cash system. The document outlined the concept of a digital currency that could operate independently of banks and other financial institutions. 

Nakamoto formally launched Bitcoin on 3 January 2009 when he mined the first block. A year later, Bitcoin was launched, thus introducing the world’s decentralized digital currency. Unlike other traditional currencies, it operates on a peer-to-peer network, implying that transactions occur without an intermediary. 

In 2009, as Bitcoin was launched, the New Liberty Standards established the initial exchange rate, marking a major milestone for cryptocurrency. Thanks to this development, cryptocurrencies shifted from theory into real tradable commodities. 

A year later, in 2010, the first real-world Bitcoin transaction occurred on 22 May. It remains popular to date as Bitcoin Pizza Day. With Bitcoin entering the real world, Forbes named it the best investment of the year in 2013. 

At first, Bitcoin was adopted by a few tech enthusiasts who were fascinated by the concept of decentralized money. Since then, Bitcoin adoption has accelerated significantly, surpassing $2 trillion in market value at its peak thanks to millions of users. 

Bitcoin’s growth was further accelerated by its open-source nature. This allowed anyone with internet access to participate. The openness fostered a global community of miners, developers, and users contributing to the network’s development and security. 

Even more importantly, Bitcoin went mainstream, shifting from individual users to institutional and large entities. In fact, Bitcoin adoption reached state levels too. 

As such, countries, central banks, and major institutional investors have added Bitcoin to their balance sheets over the last few years. 

For example – The United States created the Bitcoin Strategic Reserve and now holds 198K BTC worth $14 billion. Other governments, such as China, the UK, El Salvador, and Bhutan, hold BTC with a combined value exceeding $20 billion. 

Additionally, over 60 publicly traded companies hold 1.16 million BTC – Worth $85.9 billion. Among publicly traded companies, Strategy led with 7,61,070 BTC worth $57 billion in mid-March 2026.

Coupled with that, TradFi got access to Bitcoin through Spot ETFs, indicating growing acceptance in the mainstream. In March 2026, Bitcoin Spot ETFs commanded over $96.7 billion in Total Net Assets. 

Bitcoin’s acceptance by institutional investors underscores Wall Street’s confidence in the asset. This gives the crypto community the acknowledgement many have sought for years, creating an environment conducive to attracting new users. 

However, the rise of Bitcoin also saw a surge in criminal activities and the collapse of associated companies. The most dramatic period in Bitcoin’s history was the rise and collapse of FTX. FTX’s collapse in November 2022 left $8.9 billion in customer funds missing, and the exchange ended with $50 billion in debt. FTX declared bankruptcy, followed by the arrest and imprisonment of Sam Bankman-Fried. 

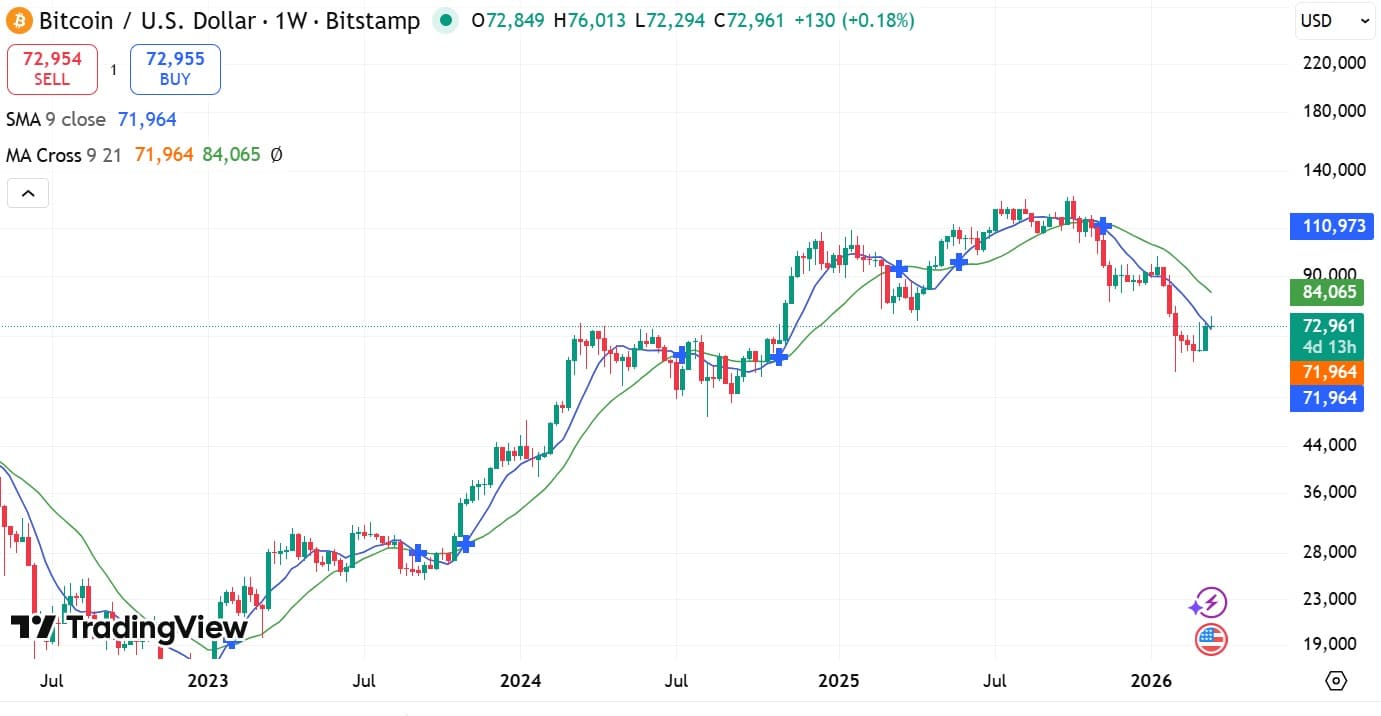
In 2026, the worst for Bitcoin is already long forgotten, and the crypto’s position in the global market is stronger and more influential than ever. Today, BTC is owned by states, used to avoid sanctions, to fund wars, and useful in every transaction. 

VIEW MORE

Overview

Market Cap
$1.27T
+1.0%
Volume (24H)
$21.21B
Volume (7D)
$184.91B
-0.2%
Max Supply
21,000,000 BTC
Circulating Supply
20,045,168 BTC
All-Time High
$126,080.00
-49.7%
All-Time Low
$67.81
+93,450.5%
(above ATL)

Prediction Analysis

Current Price
$63,436.00
Sentiment
Bearish
50-Day SMA
$72,682.66
Price Prediction
$66,432.45
+5.00%
Fear & Greed Index
200-Day SMA
$77,011.15
Green Days
10 / last 30 (34.5%)
Volatility
2.22%
Moderate
14-Day RSI
59.06
Neutral

Profit Calculator

Select asset
%
%
Total Profit
$0
(0%)
Total Exit Amount
$0
Total Investment Fee
$0
Total Exit Fee
$0

Bitcoin Price Prediction

Current Price
$63,436.00
2031
$80,962.20
2036
$103,330.56
2041
$131,878.89
2046
$168,314.59

Results are based solely on your predicted price change. They are not indicators of future performance and do not take into account different performance scenarios, historical data, or the effect of fees or other charges.

VIEW MORE

Short-Term Bitcoin Price Targets

Date Prediction Change
Jun 21, 2026 $62,739.62 -1.10%
Jun 22, 2026 $62,050.88 -2.18%
Jun 23, 2026 $61,369.70 -3.26%
Jun 24, 2026 $60,696.00 -4.32%
Jun 25, 2026 $60,029.69 -5.37%
Jun 26, 2026 $59,370.70 -6.41%
Jun 27, 2026 $58,718.95 -7.44%

Bitcoin's price was trading at around $73K at press time, following the establishment of strong support around $70K. Bitcoin turned mildly bullish after extending its stay above $70K, closing at higher lows over three weekly candles. In March 2026, this range was serving as a key support level, with both short-term and simple moving averages below it. In the short term, BTC registered strong upside momentum, holding above the 9MA and SMA which sat around $71K. Therefore, if Bitcoin continues to hold above $71K, the upside momentum could extend with $84K acting as the immediate resistance. If the $71K support level fails to hold on, BTC will look to find support around $65K.

VIEW MORE

Monthly Bitcoin Price Prediction

May 31, 2026
$73,570.22
Jun 19, 2026
$63,513.66
Highest in Jun
$73,797.23
Lowest in Jun
$59,353.42
Overall Performance
Falling

Long-Term Bitcoin Price Prediction

Month Price AVG Price Max Price Change
Jun $68,510.88 $65,973.44 $65,973.44 +8.00%
Jul $73,991.75 $71,251.32 $71,251.32 +16.64%
Aug $79,911.09 $76,951.42 $76,951.42 +25.97%
Sep $86,303.98 $83,107.53 $83,107.53 +36.05%
Oct $93,208.30 $89,756.14 $89,756.14 +46.93%
Nov $100,664.96 $96,936.63 $96,936.63 +58.69%
Dec $108,718.16 $104,691.56 $104,691.56 +71.38%
Over the long term, Bitcoin has been entrenched in a bearish structure. In fact, on the monthly charts, it was still closing at higher and lower lows, only closing above $70K once. At the same time, Bitcoin’s Future Trend Indicator revealed that BTC was stuck between the EMA and the lower confidence band. This hinted at a weakened market structure, with the market eyeing a possible pullback or consolidation on a positive note. Also, the True Strength Index showed possible sustained weakness after forming a bearish crossover. This suggested that BTC exhibited long-term weakness and could drop towards $51K. However, reclaiming the $84K resistance will avoid this downside risk, positioning BTC to target $113K.
VIEW MORE

Historical Price Performance

Year Highest Price Lowest Price
2026 (to date) $97,008 $60,862
2025 $124,774 $76,329
2024 $106,074 $39,505
2023 $44,202 $16,541
2022 $47,816 $15,742
2021 $67,617 $29,022
2020 $28,837 $5,033
2019 $12,996 $3,394
2018 $18,344 $3,217
2017 $19,665 $784
2016 $977 $364
2015 $465 $172
2014 $936 $310
2013 $1,127 $68

Historically, Bitcoin has traded in an uptrend, with periodic pullbacks. BTC reached the $1 milestone in 2011, rose to $12, and crashed to $3 though the said year. In 2012, Bitcoin traded within an ascending channel, crossed the $100 milestone in early 2013, and the $1K mark the same year. After it hit $1K, BTC's price retraced and traded within a consolidation range for 3 years. In 2017, the market recovered, and the bull run saw BTC hit $19.6K before crashing and entering a sharp downtrend. It declined to $3.1K, before recovered to $12K in 2019. It later crashed to $4K in early 2020 due to the COVID-19 pandemic. However, the market recovered towards the end of 2020, setting the ground for the 2021 bull run that saw BTC surpass $60K. The 2021 bull run was driven by institutional adoption and DeFi expansion. However, the crypto market crashed to a low of $16K in 2022, driven by FTX's collapse. This episode shook the broader market. After the market recovered from the incident, BTC traded within an ascending channel, crossing $70K following the approval of Spot ETFs in 2024. In late 2024, the rally extended itself following Donald Trump's re-election as pro-crypto policies drove BTC past $100K. This trend extended into 2025 until October, when another bear run started, sending BTC to a low of $60K.

VIEW MORE

Technical Analysis

In mid-March 2026, Bitcoin’s price was exhibiting short-term strength, with the crypto extending its stay above $70K and holding this level as strong support. In fact, the crypto flipped short-term moving averages, hinting at recovered demand over the past three weeks. 

Buyers pushed BTC above the 9MA and SMA at $71K, highlighting the strength of this trend. If Bitcoin holds above these price levels, it would be strong enough to target the 3-week moving average (21MA) at $84K.

Source: BTC/USDT, TradingView

In the short- to medium-term, the trend’s strength will depend on the ability to hold above $71K. Failure to do so will trigger a deeper slide above these price levels, exposing the underlying weakness. 

Such a shift will push BTC down towards $65K – A level which has previously acted as support. 

Across longer timeframes, if BTC holds above $71K and realizes these short-term gains, the long-term trend will strengthen itself. This upside strength can be expected to flip $84K and then target $113K, where the RMSE sat at press time. 

However, the TSI at 13 showed a strong bearish bias in the long term as the market had not yet strengthened enough. For this trend reversal, the True Strength Index needs to at least rise towards 30. 

In doing so, the market will have absorbed enough demand to sustain another uptrend towards $110K, where the uptrend collapsed. Failure to do so will likely result in the bearish structure continuing, with pullbacks as observed on the weekly charts. 

Guides

How to Read Bitcoin Charts and Predict Price Movements?

Most traders use candlestick charts, as they provide more information than a simple line chart. Traders can view candlesticks that represent the price action of Bitcoin with different granularity – for example, you could choose a 5-minute candlestick chart for extremely short-term price action or choose a weekly candlestick chart to identify long-term trends. 1-hour, 4-hour, and 1-day candlestick charts are among the most popular.

Let’s use a 1-hour candlestick chart as an example of how this type of price chart gives us information about opening and closing prices. The chart is divided into “candles” that give us information about Bitcoin’s price action in 1-hour chunks. Each candlestick will display the asset’s opening price, closing price, as well as the highest and lowest prices reached within that period.

Bitcoin Price Prediction Indicators

Moving averages are among the most popular Bitcoin price prediction tools. As the name suggests, a moving average provides the average closing price over a selected time frame, which is divided into a number of periods of the same length. For example, a 12-day simple moving average is calculated by summing the closing prices over the last 12 days and dividing the result by 12.

In addition to the simple moving average (SMA), traders also use another type of moving average called the exponential moving average (EMA). The EMA gives more weight to recent prices, and therefore reacts more quickly to changes in market conditions.

What Affects the Price of Bitcoin?

Just like with any other asset, the price action of Bitcoin is driven by supply and demand. These dynamics can be influenced by fundamental events such as block reward halvings, hard forks, or new protocol updates. Regulations, adoption by companies and governments, cryptocurrency exchange hacks, and other real-world events can also affect market sentiment.

Technical indicators such as moving averages, RSI, and trading volume are also used by traders to anticipate price movements and identify potential trend reversals.

FAQs on Bitcoin Price Predictions

As of today, Bitcoin (BTC) is trading at $63,436.00. The current market sentiment is Bearish, with RSI at 59.06 (Neutral) and volatility classified as Moderate.
Based on our technical analysis and projected annual growth rate, Bitcoin could reach $66,607.80 by 2027. This estimate assumes continued market momentum and adoption trends.
According to our technical analysis indicators, the Bitcoin price prediction is forecasted to reach $80,962.20 within the next five years (by 2031). Over the last 30 days, Bitcoin recorded green days 35% of the time.
Based on multiple technical indicators, the current outlook for Bitcoin in 2026 is Bearish. RSI currently sits at 59.06, which indicates Neutral momentum. However, investors should evaluate both technical signals and fundamental developments before making any investment decisions.
Based on long-term projections and historical crypto market cycles, Bitcoin could reach $103,330.56 within the next decade (by 2036).
While Bitcoin's future value depends on various factors, technical indicators suggest it could experience both bullish and bearish cycles over time. Long-term investors typically monitor RSI levels, moving averages, and broader market sentiment when evaluating BTC's future trajectory.
Disclaimer

AMBCrypto's content is meant to be informational in nature and should not be interpreted as investment advice. Trading, buying or selling cryptocurrencies should be considered a high-risk investment and every reader is advised to do their own research before making any decisions.