Bitcoin [BTC]’s latest surge may not last long and the culprit is none other than…

The price per Bitcoin [BTC] grew by 5.16% in the last 24 hours, and stood at $21,612.76 as per data from CoinMarketCap revealed. The king coin was impacted by the broader financial assets market drawdown. This led to the price falling by 12% in August alone.
However, the BTC market remains consistent and follows well-developed trends in the longer term as BTC HODLers remain “resolute in their conviction”. Short-term investors continue to face challenging times. This is because macro factors continue to push the price of the number one coin southward.
BTC for sale
According to CryptoQuant analyst, Mignolet, in the last few days, accumulating whales have continued to hold on to their BTCs. Furthermore, on-chain data suggested that not many BTCs have been sold.
According to Mignolet, the last few days have been marked by a decline in the price of the leading coin. Yet the amount of BTCs distributed within that period has been minute. This, according to Mignolet, occurs when the broader market is not interested in buying the BTCs offered for sale.
Interestingly, the referenced price drop has not resulted from whales selling in large quantities. Mignolet further pointed out that these categories of holders have been uninterested in realizing a profit. Instead, no one is just interested in buying.

BTC in the last 24 hours
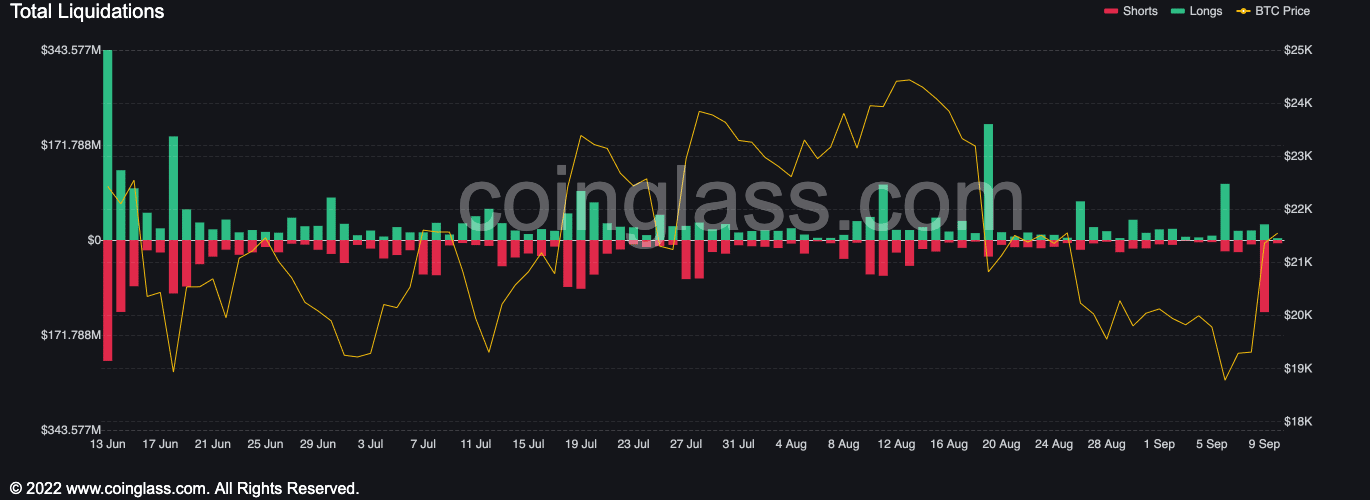
According to Mignolet not many BTCs had been distributed in the past few days. However, in the last 24 hours, $109,646,746 were taken out of the BTC market, data from Coinglass revealed. These BTC liquidations represent 62% of the total $297.32 million taken out of the general cryptocurrency market within the same period.
On a daily chart, the leading coin appeared to have registered traction following the price rally in the last 24 hours. According to CoinMarketCap, with a 5% growth in the price per BTC, the coin’s trading volume went up by 18% in the last 24 hours.
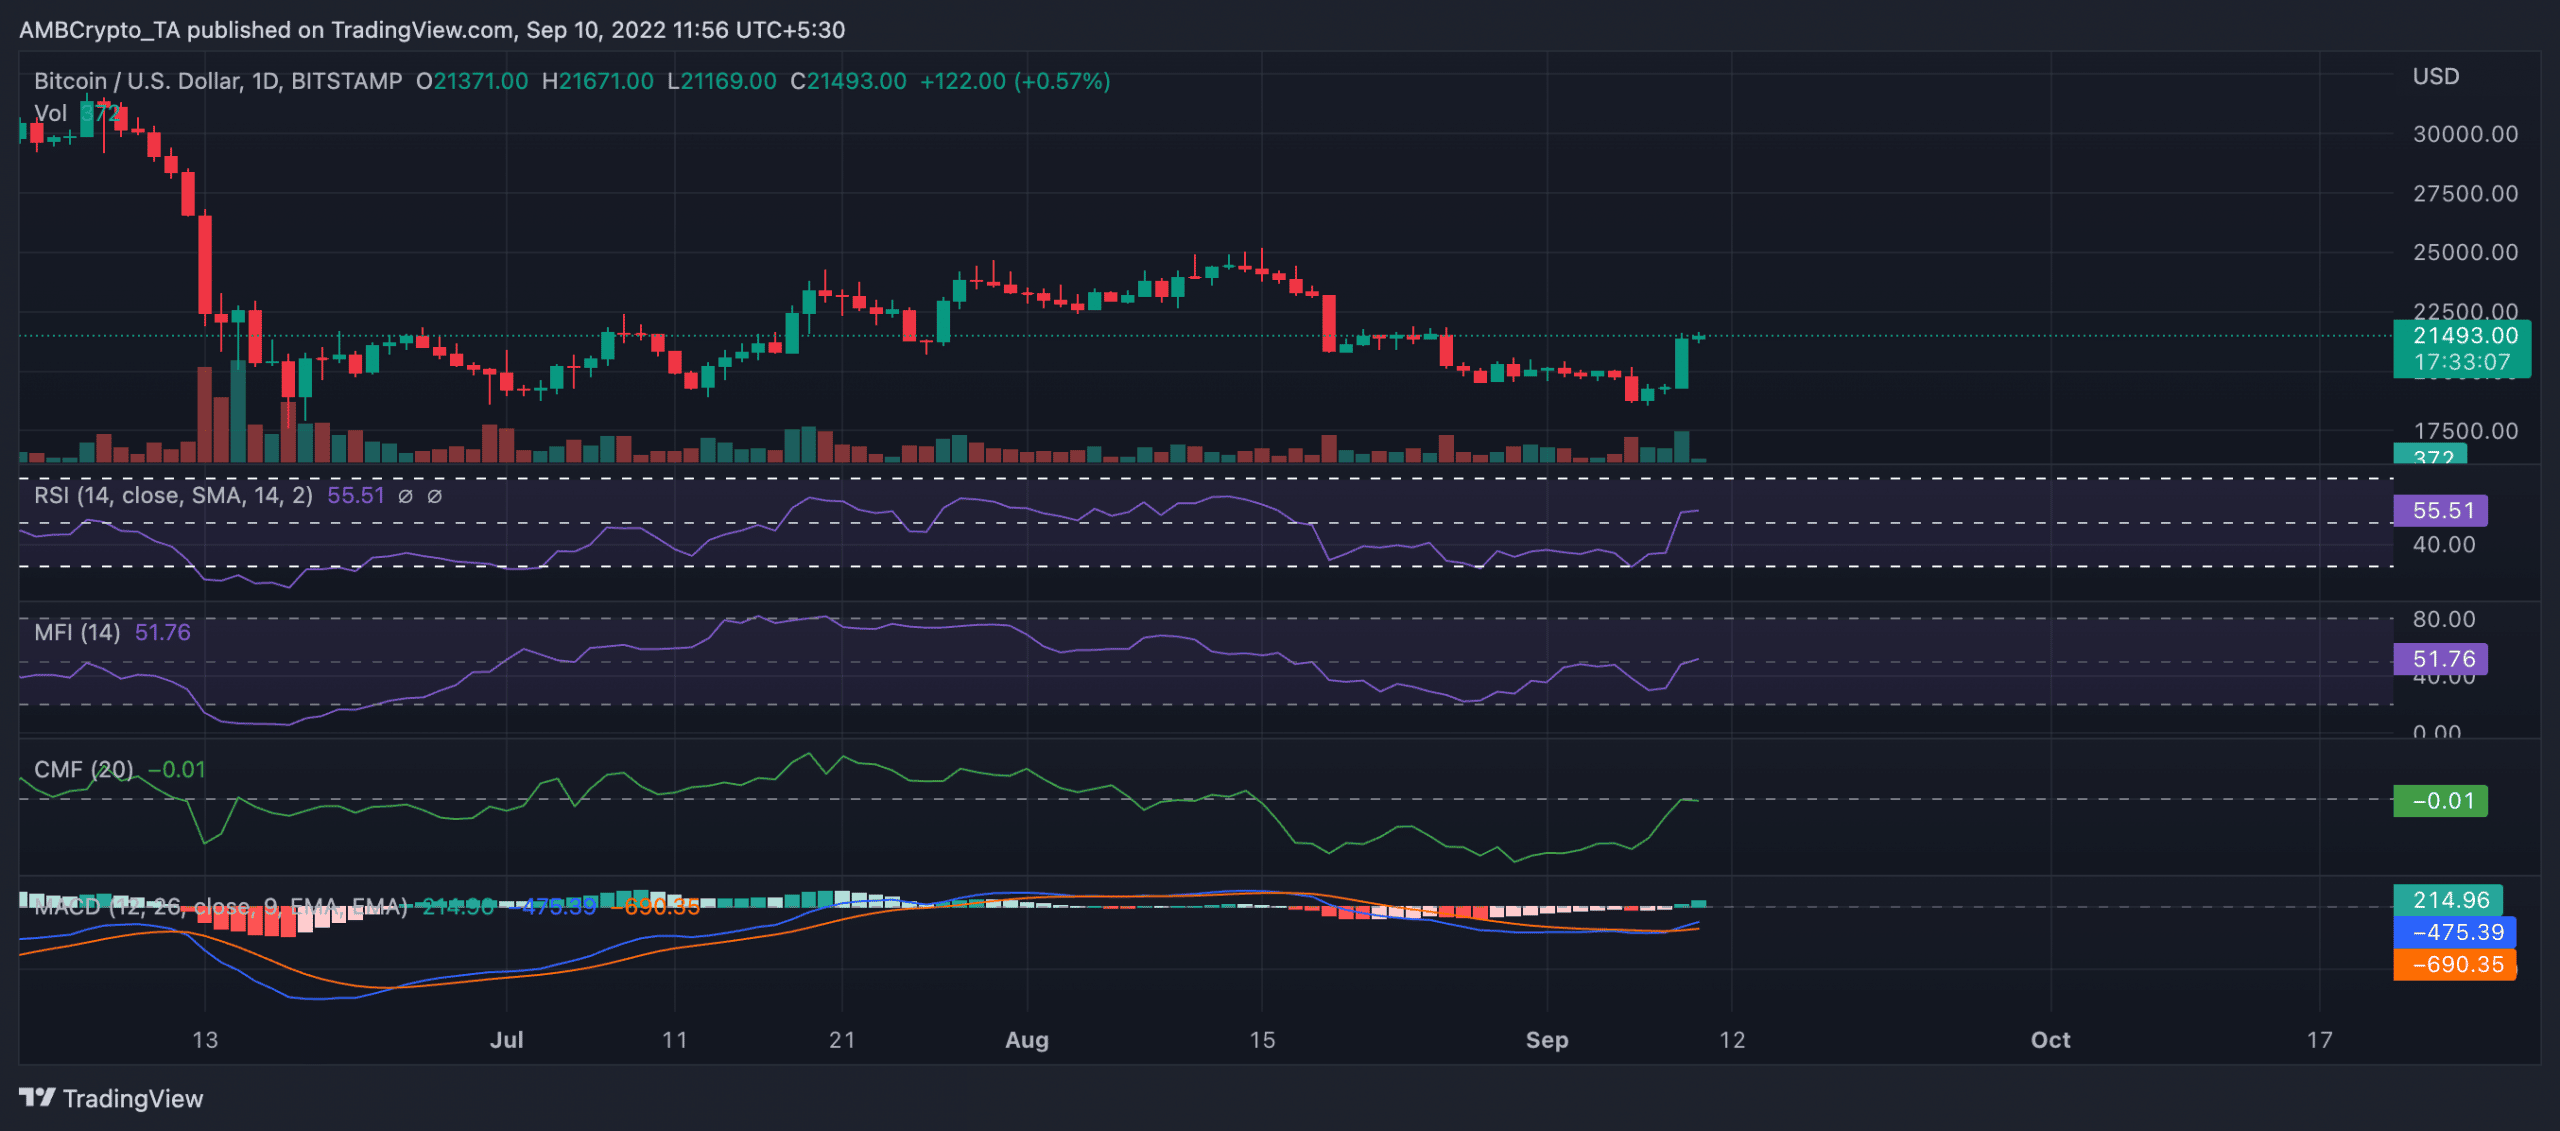
As of this writing, buying pressure, albeit slow, had gathered some momentum. This pushed key indicators such as Relative Strength Index (RSI) and Money Flow Index (MFI) northward. BTC’s RSI was 55. Its MFI was also positioned above the 50 neutral region at 51. Although found flat, the coin’s Chaikin Money Flow (CMF) had attempted a cross-over at the center (0.0) line. It was found at -0.1 at press time.
BTC’s Moving Average Convergence Divergence (MACD) line intersected the trend line in an upward direction on 8 September. This is usually indicative of the commencement of a bull cycle.
While this is not enough to conclude that a bull run was underway, a look at network activity for the leading coin in the past week lent credence to the position. Unique addresses that traded BTC daily in the past seven days have grown by 4%.
Data from Santiment also revealed significant growth in BTC’s trading volume in the last seven days. Within that period, this grew by 45%.


