Bitcoin’s entry in the new year is a much-anticipated event and has often left the market surprised. This time, however, the top asset made no major moves. The short-term bearish trajectory persisted and the hopes of a blasting entry in 2022 were met with disappointment. With Bitcoin still at the $47,188 mark, making the first green candle on 2 January- Here’s what to expect from the king coin, going forward.
Where do we stand?
BTC’s price has been ranging between $46,000 and $52,000 for the most part of last month. Its price was down 30% from its all-time high of $69,000. Despite the huge $6.1 billion year-end options expiry, the bullish and bearish narrative was equally balanced. 42 bulls and 42 bears were present over the last 7-days, as per data from IntoTheBlock.
Notably, BTC’s trend going into 2022 still looked short-term bearish and long-term in the neutral bullish zone. However, this was one of the calmest year-beginning for the top coin as the bullish narrative was waning.
After being stuck around $47,000, a sudden price pump drove it to above $48,500 on 31 December. But the price soon fell and went as low as $46,208 on the first day of 2022. The price action still looked shaky but with social volumes and positive sentiment correcting the possibility of a rally.
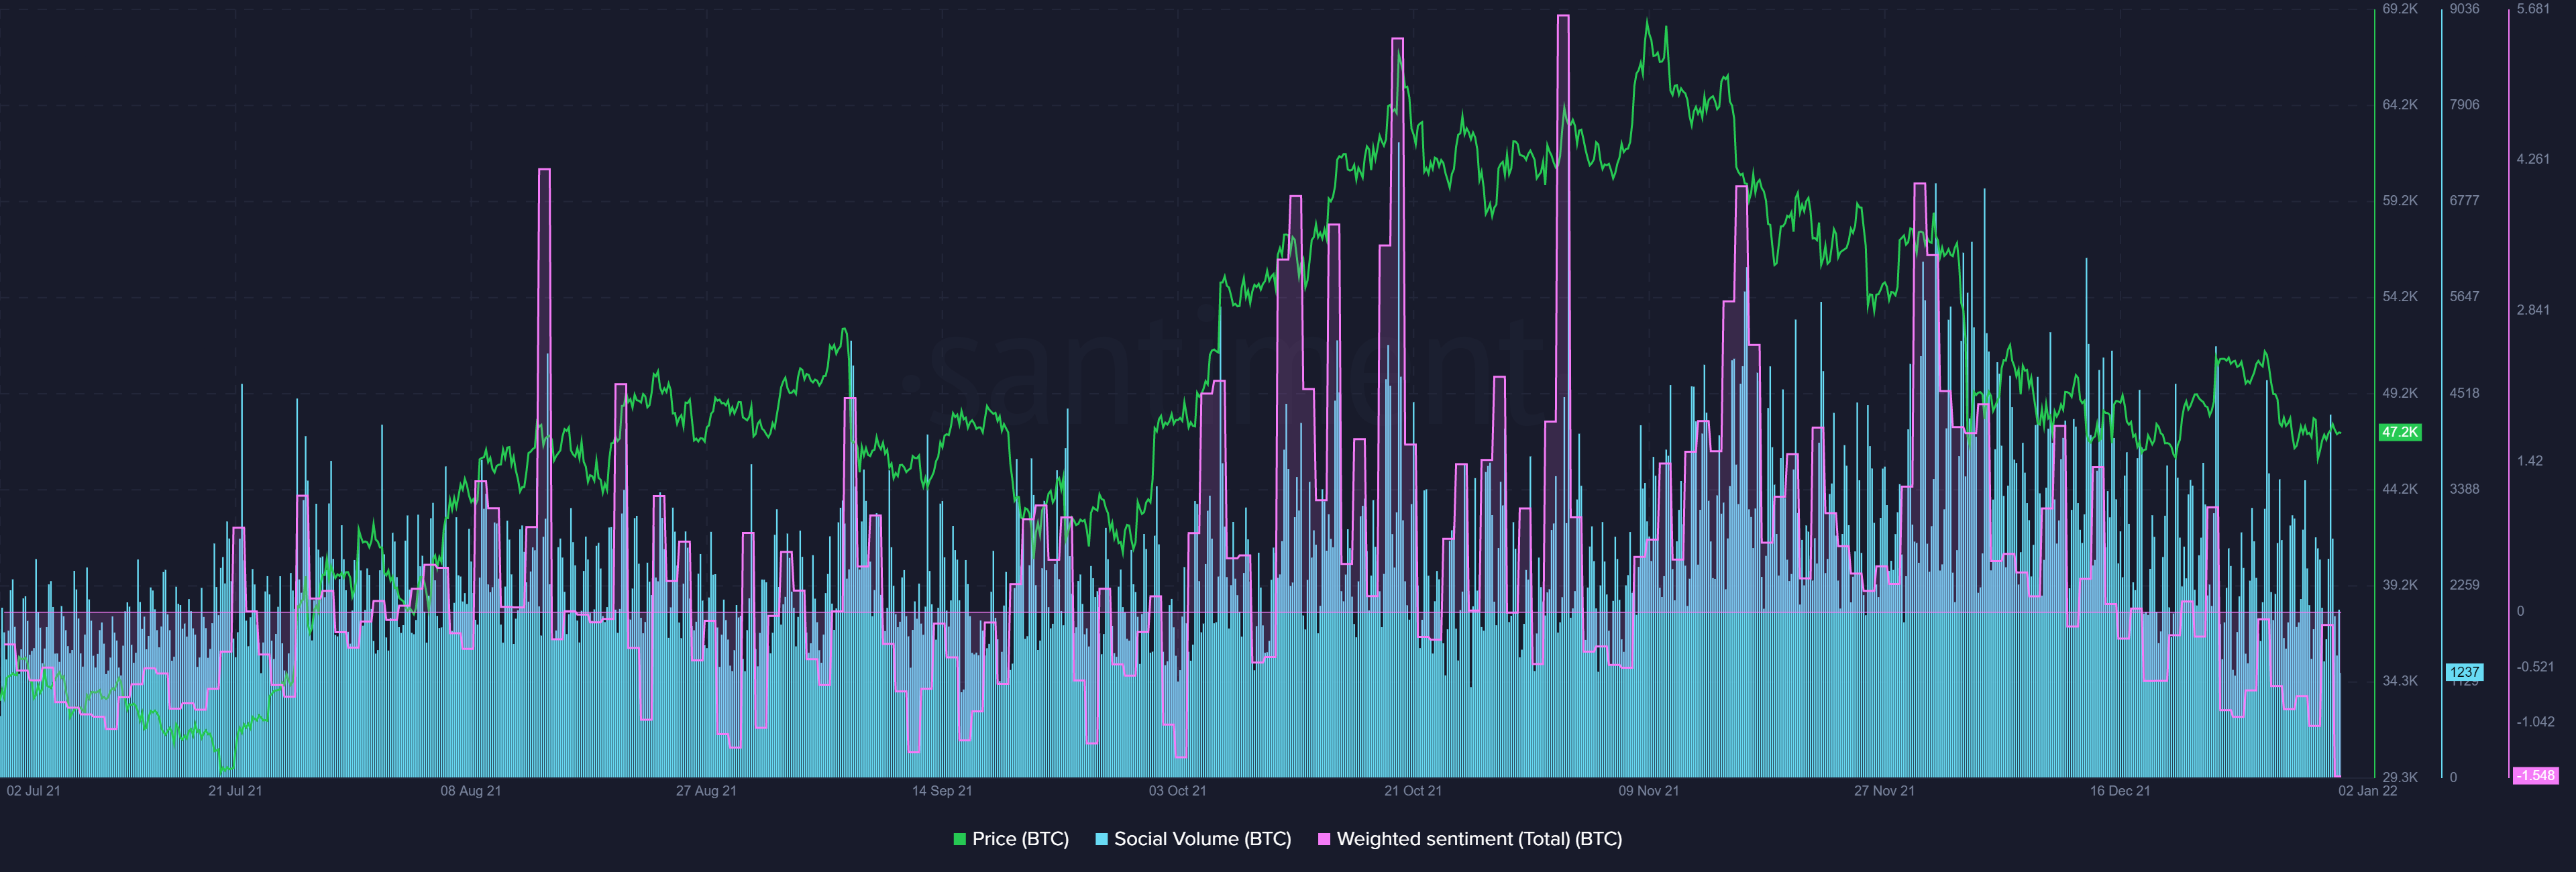
Source: Sanbase
BTC’s weighted social sentiment sat at all-time low levels, at press time. And, the same trend has often pushed the prices of the top coin in the past.
Looking back
In 2021, retail continued to stack stronger throughout the year. Meanwhile, institutions and whales bought the August-September dip then sold down during November-December. And, now they seem to be swinging towards a buy zone in January 2022.
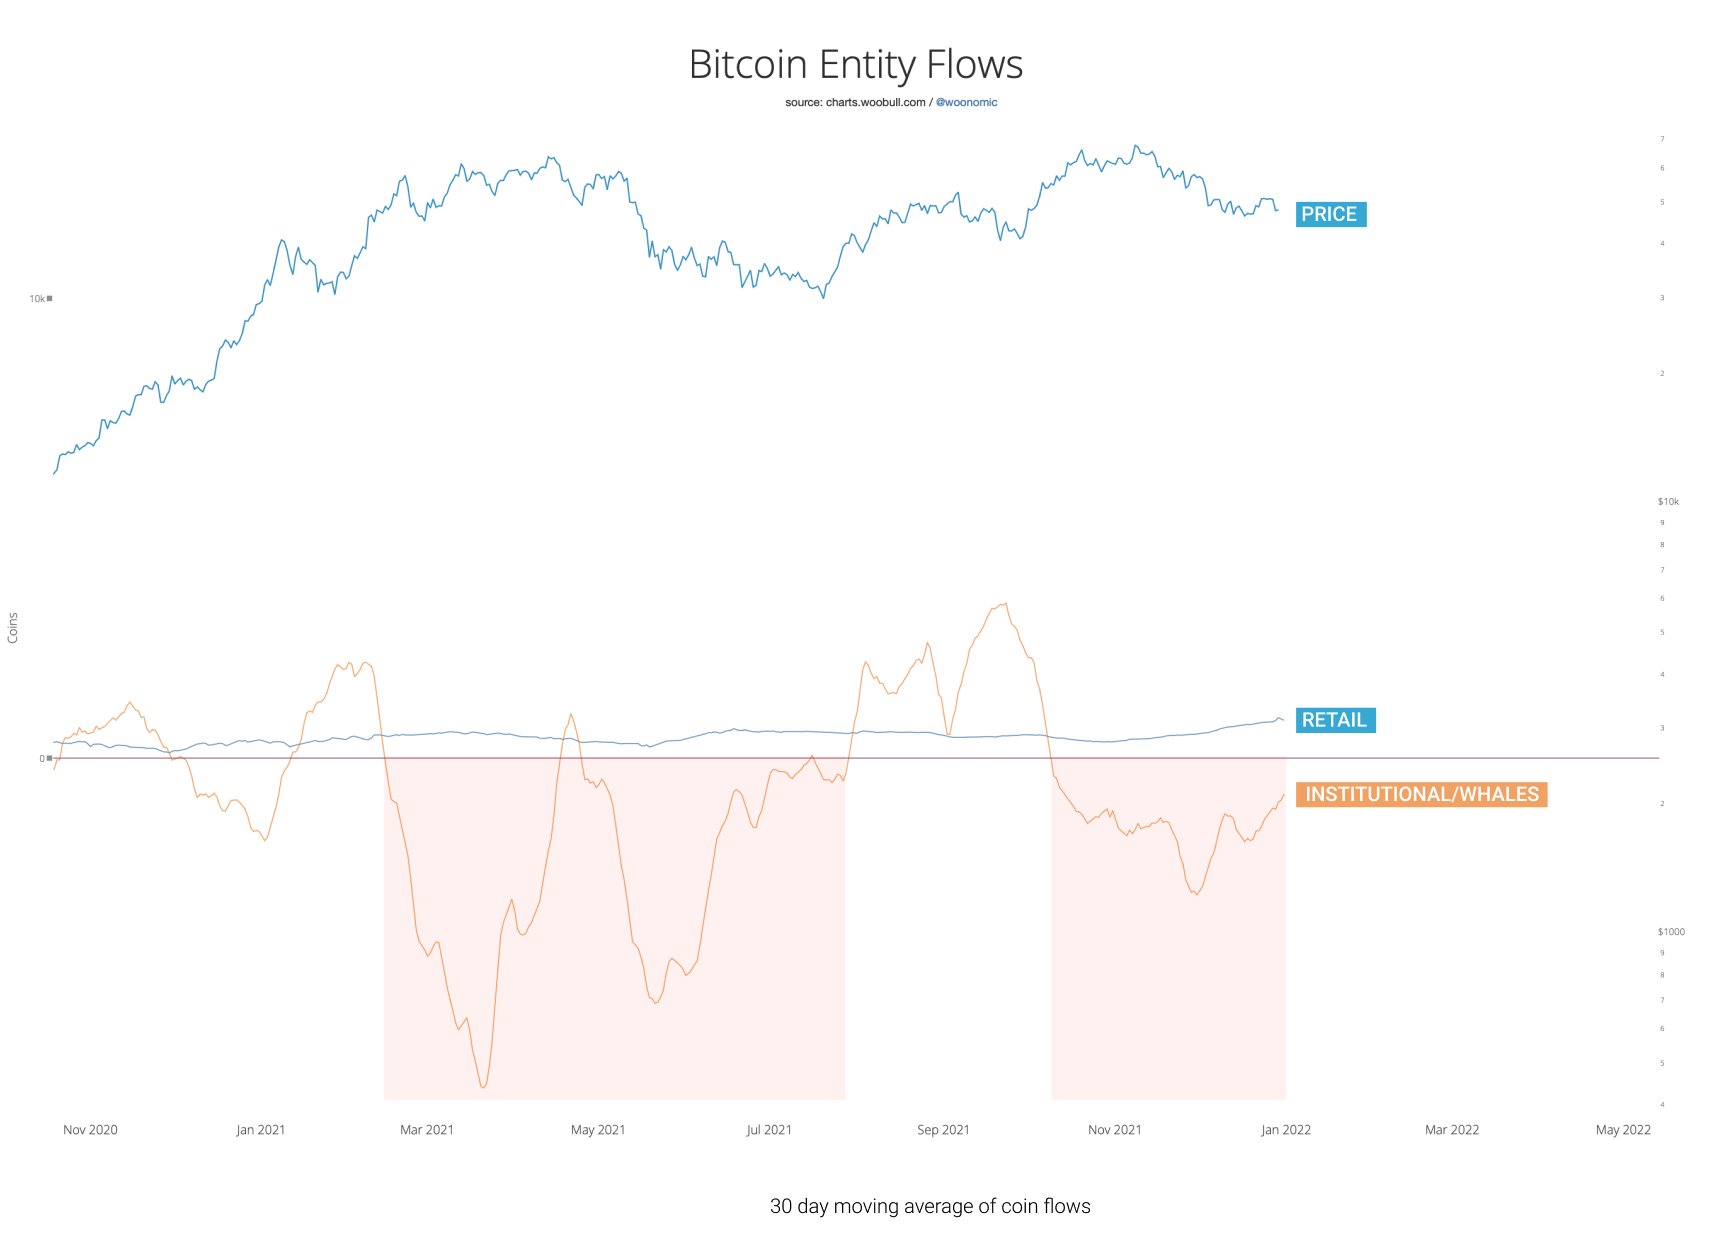
Source: Willy Woo
On a one-month timeframe, Bitcoin didn’t look so good, a Double Top bearish pattern along with a bearish RSI Divergence, was seen on the charts. While the larger market structure is still bullish, as long as Bitcoin holds above $35K, we can expect another higher high with RSI printing a hidden bullish signal.
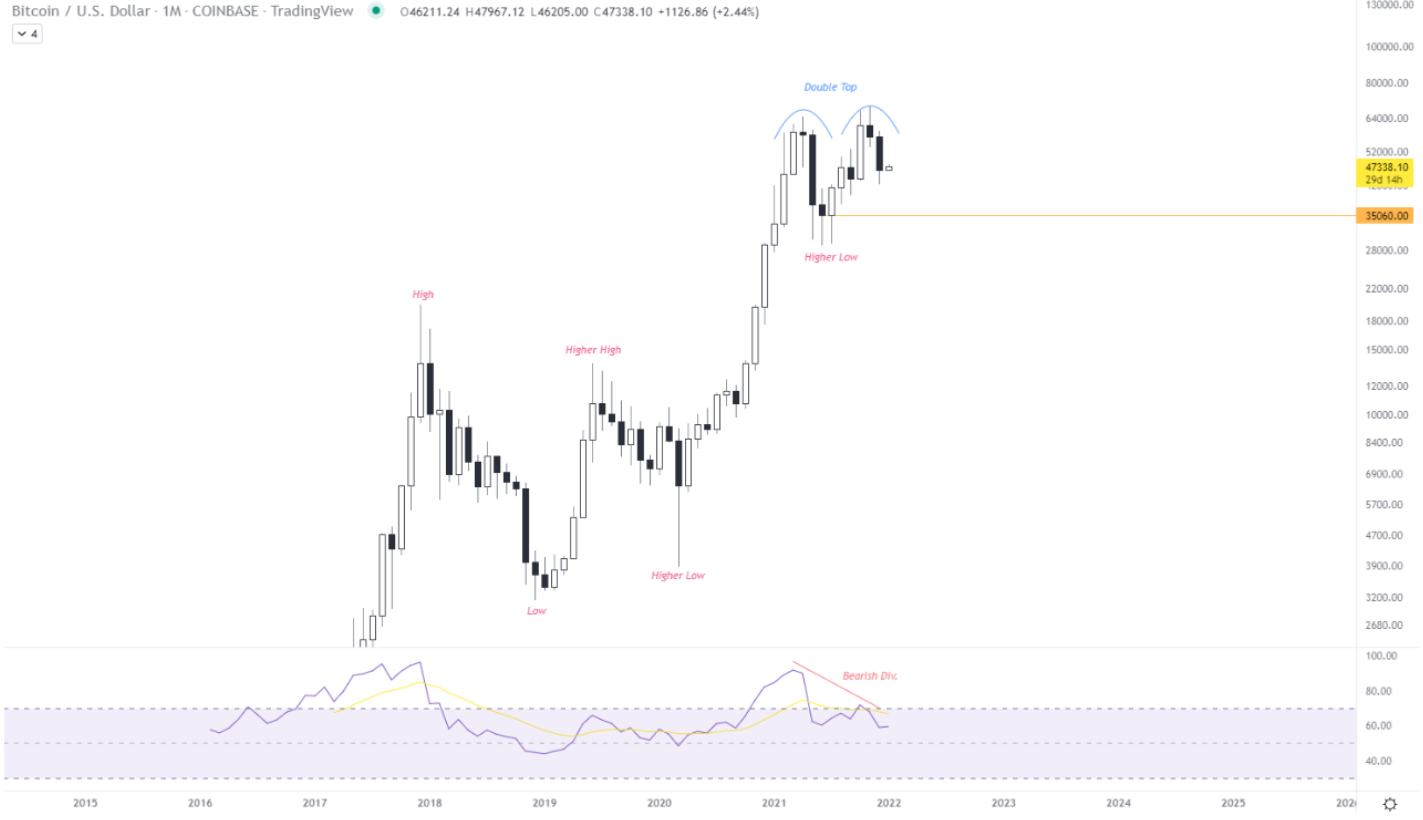
Source: CryptoQuant
So, what next?
Price-wise a neutral bullish trend is lined up with both the 30-Day and 7-Day Moving Averages while the 100 Week Moving Average looked synced up with the bearish level. The netflow of the exchanges has spent 2021 fluctuating around 5K BTC while in the last week yet another flip from net exchange outflows to net exchange inflows was seen.

Source: CryptoQuant
The Exchanges Netflow has soared from 22-28 December. Moreover, huge net exchanges inflow was noted. This is a bearish sign in the short term which has led to a shakeout and a 12% drop in the price. At the time of writing, the metric shows negative amounts indicating a short-term accumulation during the price volatility.
In the short term, it’ll be crucial to watch netflows in order to determine if the trend weakens or strengthens. Apart from that, over 20K options expiry set for 7 January can further determine the asset’s trajectory going forward.