Bitcoin Cash, Chainlink, Polygon Price Analysis: 24 October

While the cryptocurrency market has not flashed high volatility, some altcoins displayed signs of retracement.
Bitcoin Cash assumed a downtrend in the near term, while Chainlink and Polygon hit their weekly highs and started to show bearish tendencies.
Bitcoin Cash (BCH)
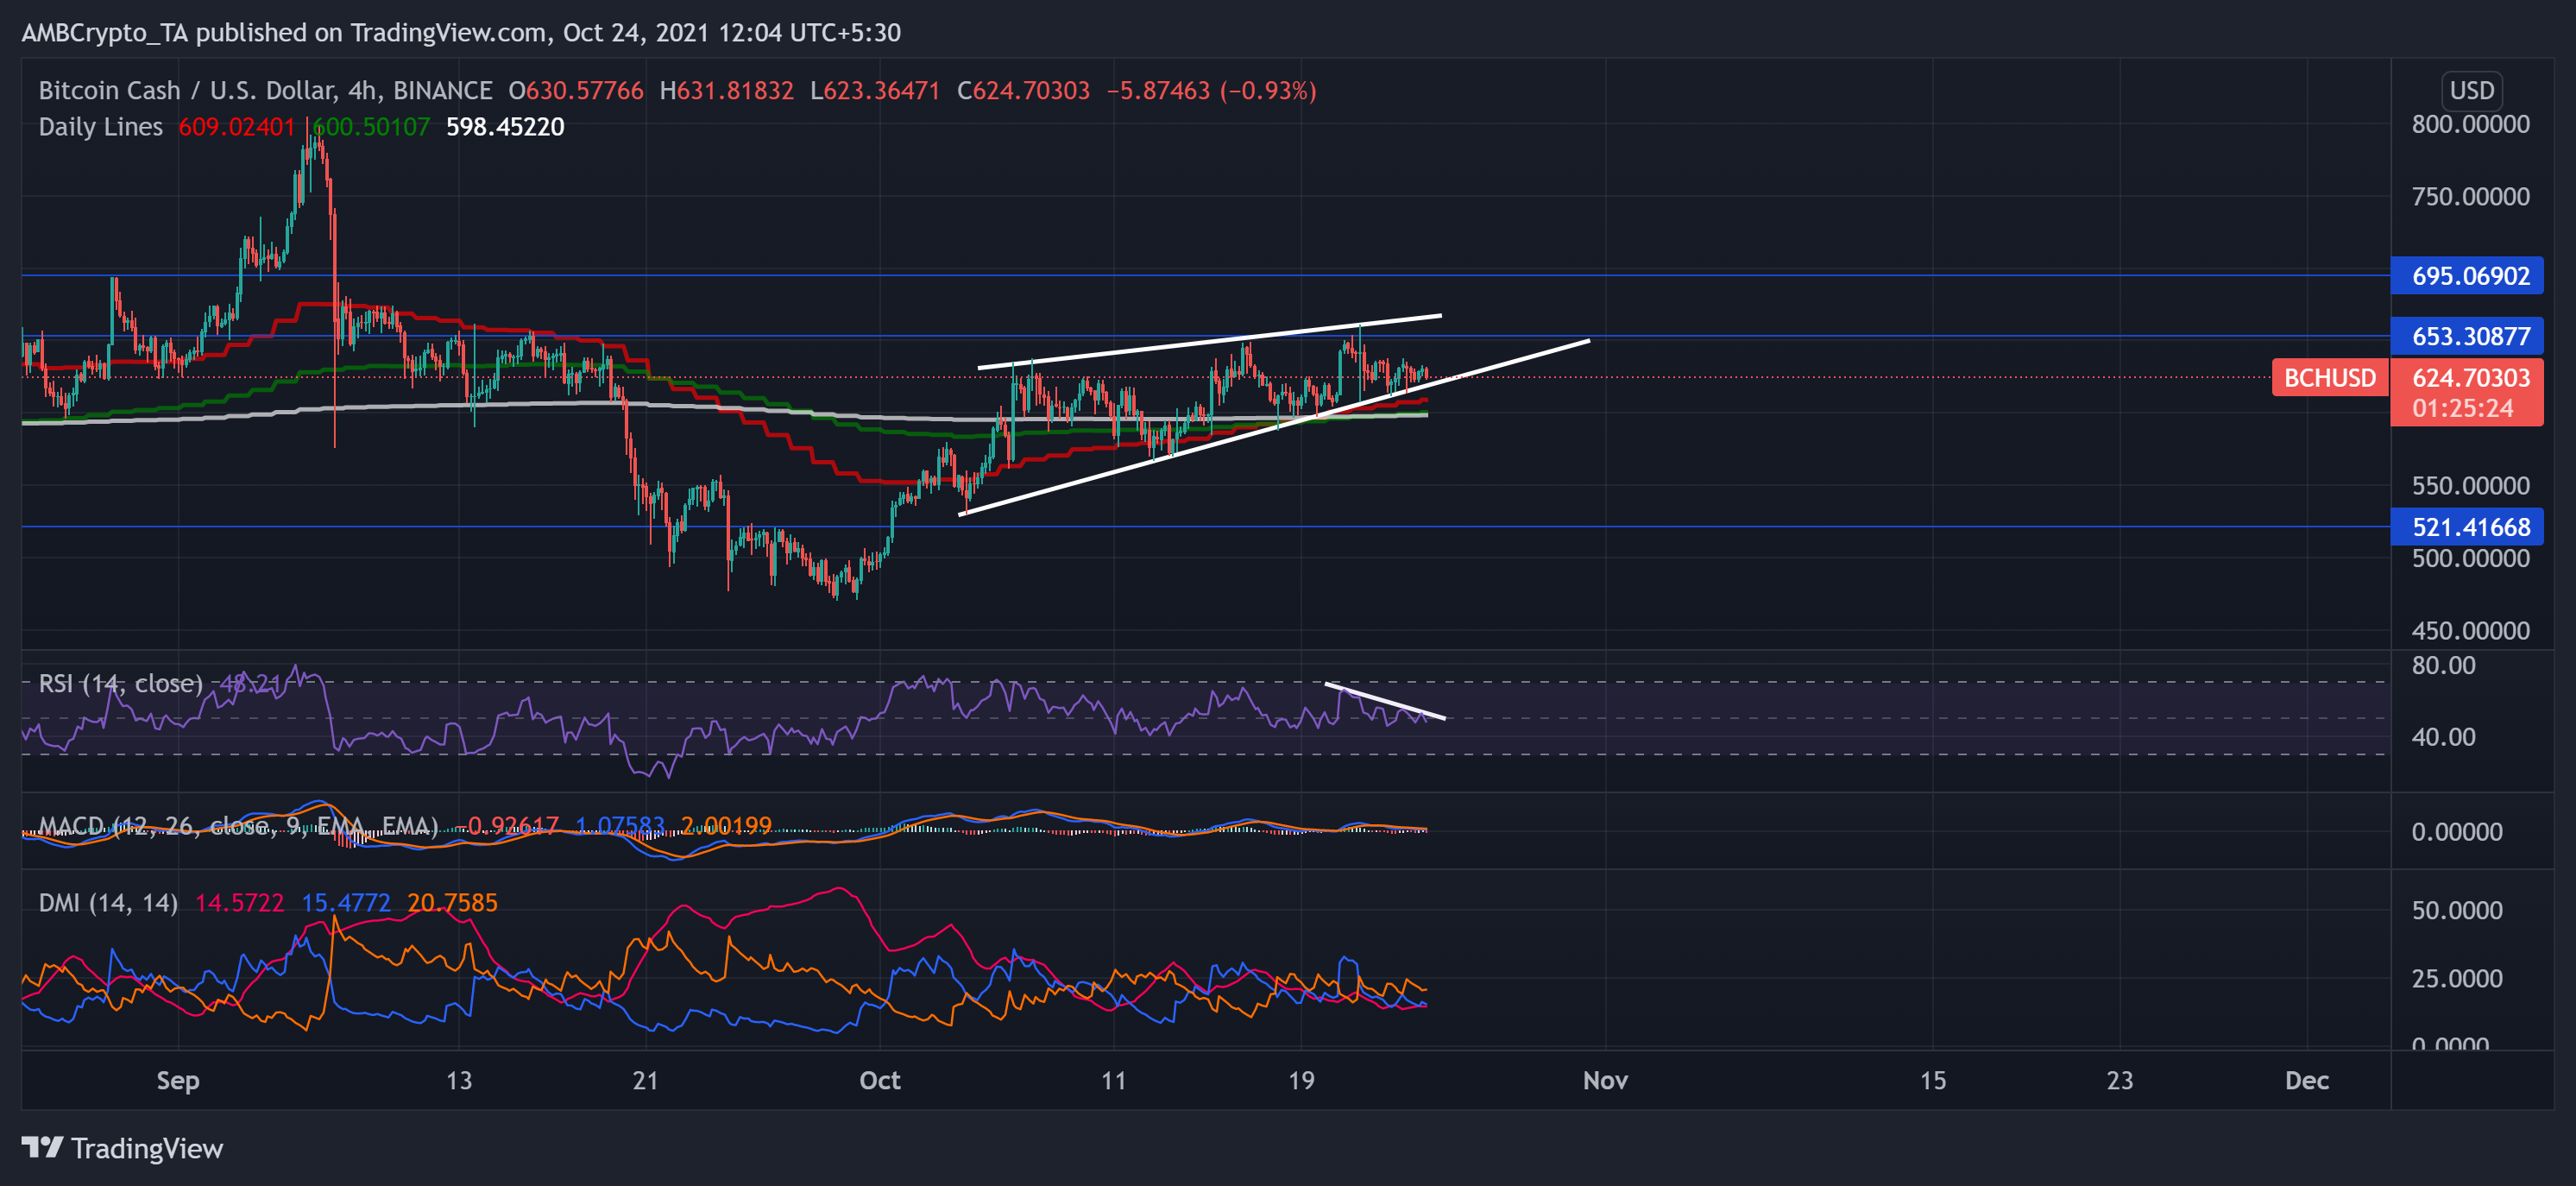
The altcoin traded at $624.70 and registered a 24-hour decrease of nearly 2%. Over the past month, BCH Bulls showed their vigor as the price oscillated in an ascending triangle pattern with higher highs, as depicted by the trendlines.
However, key technicals favored the sellers in the near term. Unless the bulls can sustain the ascending pattern, the price seemed to consolidate below its immediate resistance point that stood at $653.31.
The Relative Strength Index (RSI) was below the half-line at the 48-mark and depicted a downtrend. Also, the signal line (orange) was above the MACD while the histogram flashed red signal bars, indicating a superior selling strength.
Moreover, Directional Movement Index (DMI) corresponded with previous readings. On the other hand, the Average Directional Index (ADX) line (red) stood at the 14-mark and showed a weak directional price trend.
Chainlink (LINK)
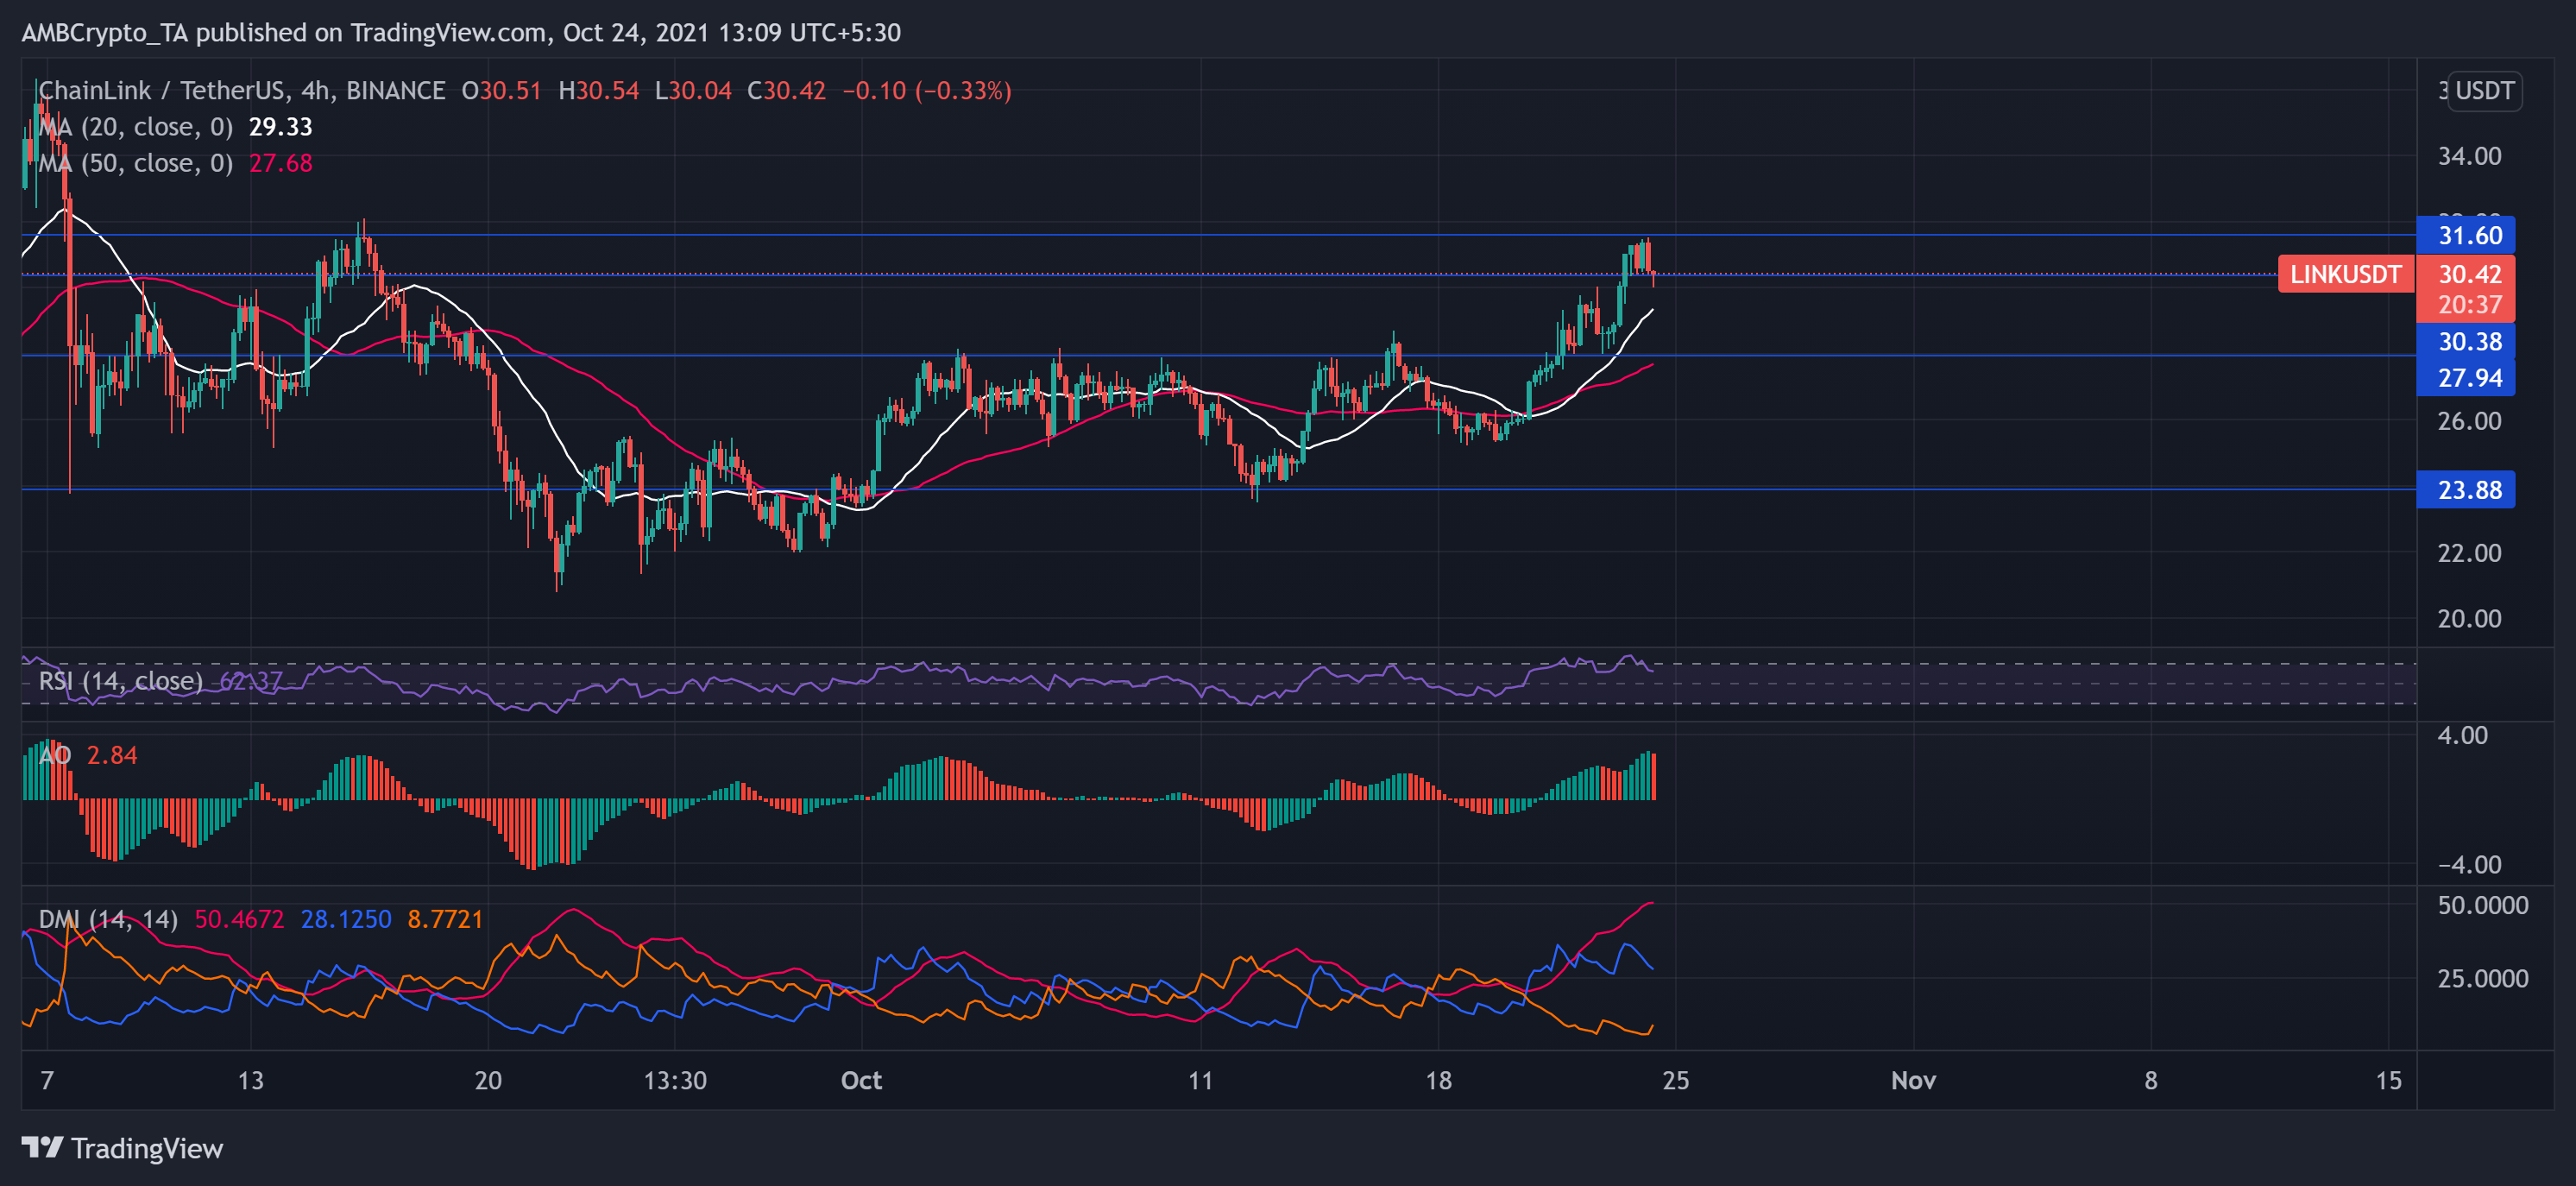
After breaching the $27-mark, the digital currency found new resistance points and assumed an upward price trajectory. LINK touched its five-week high at the $31-mark over the last day and traded near its immediate resistance at $30.42.
LINK visibly depicted bullish tendencies, noting 1.5% and 9.94% gains on its daily and weekly charts, respectively. Additionally, the trading price was above its 20-SMA (White) and 50-SMA (red), which suggested that the bulls were keen on sustaining their pressure.
However, key technicals pointed in favor of increasing selling strength. The RSI plunged by 12 points towards the overbought territory looking south.
Furthermore, the +DI Line depicted a superior buying strength but displayed a downtrend. Also, the Awesome Oscillator flashed a red signal bar, hinting at decreasing buying strength.
Polygon (MATIC)
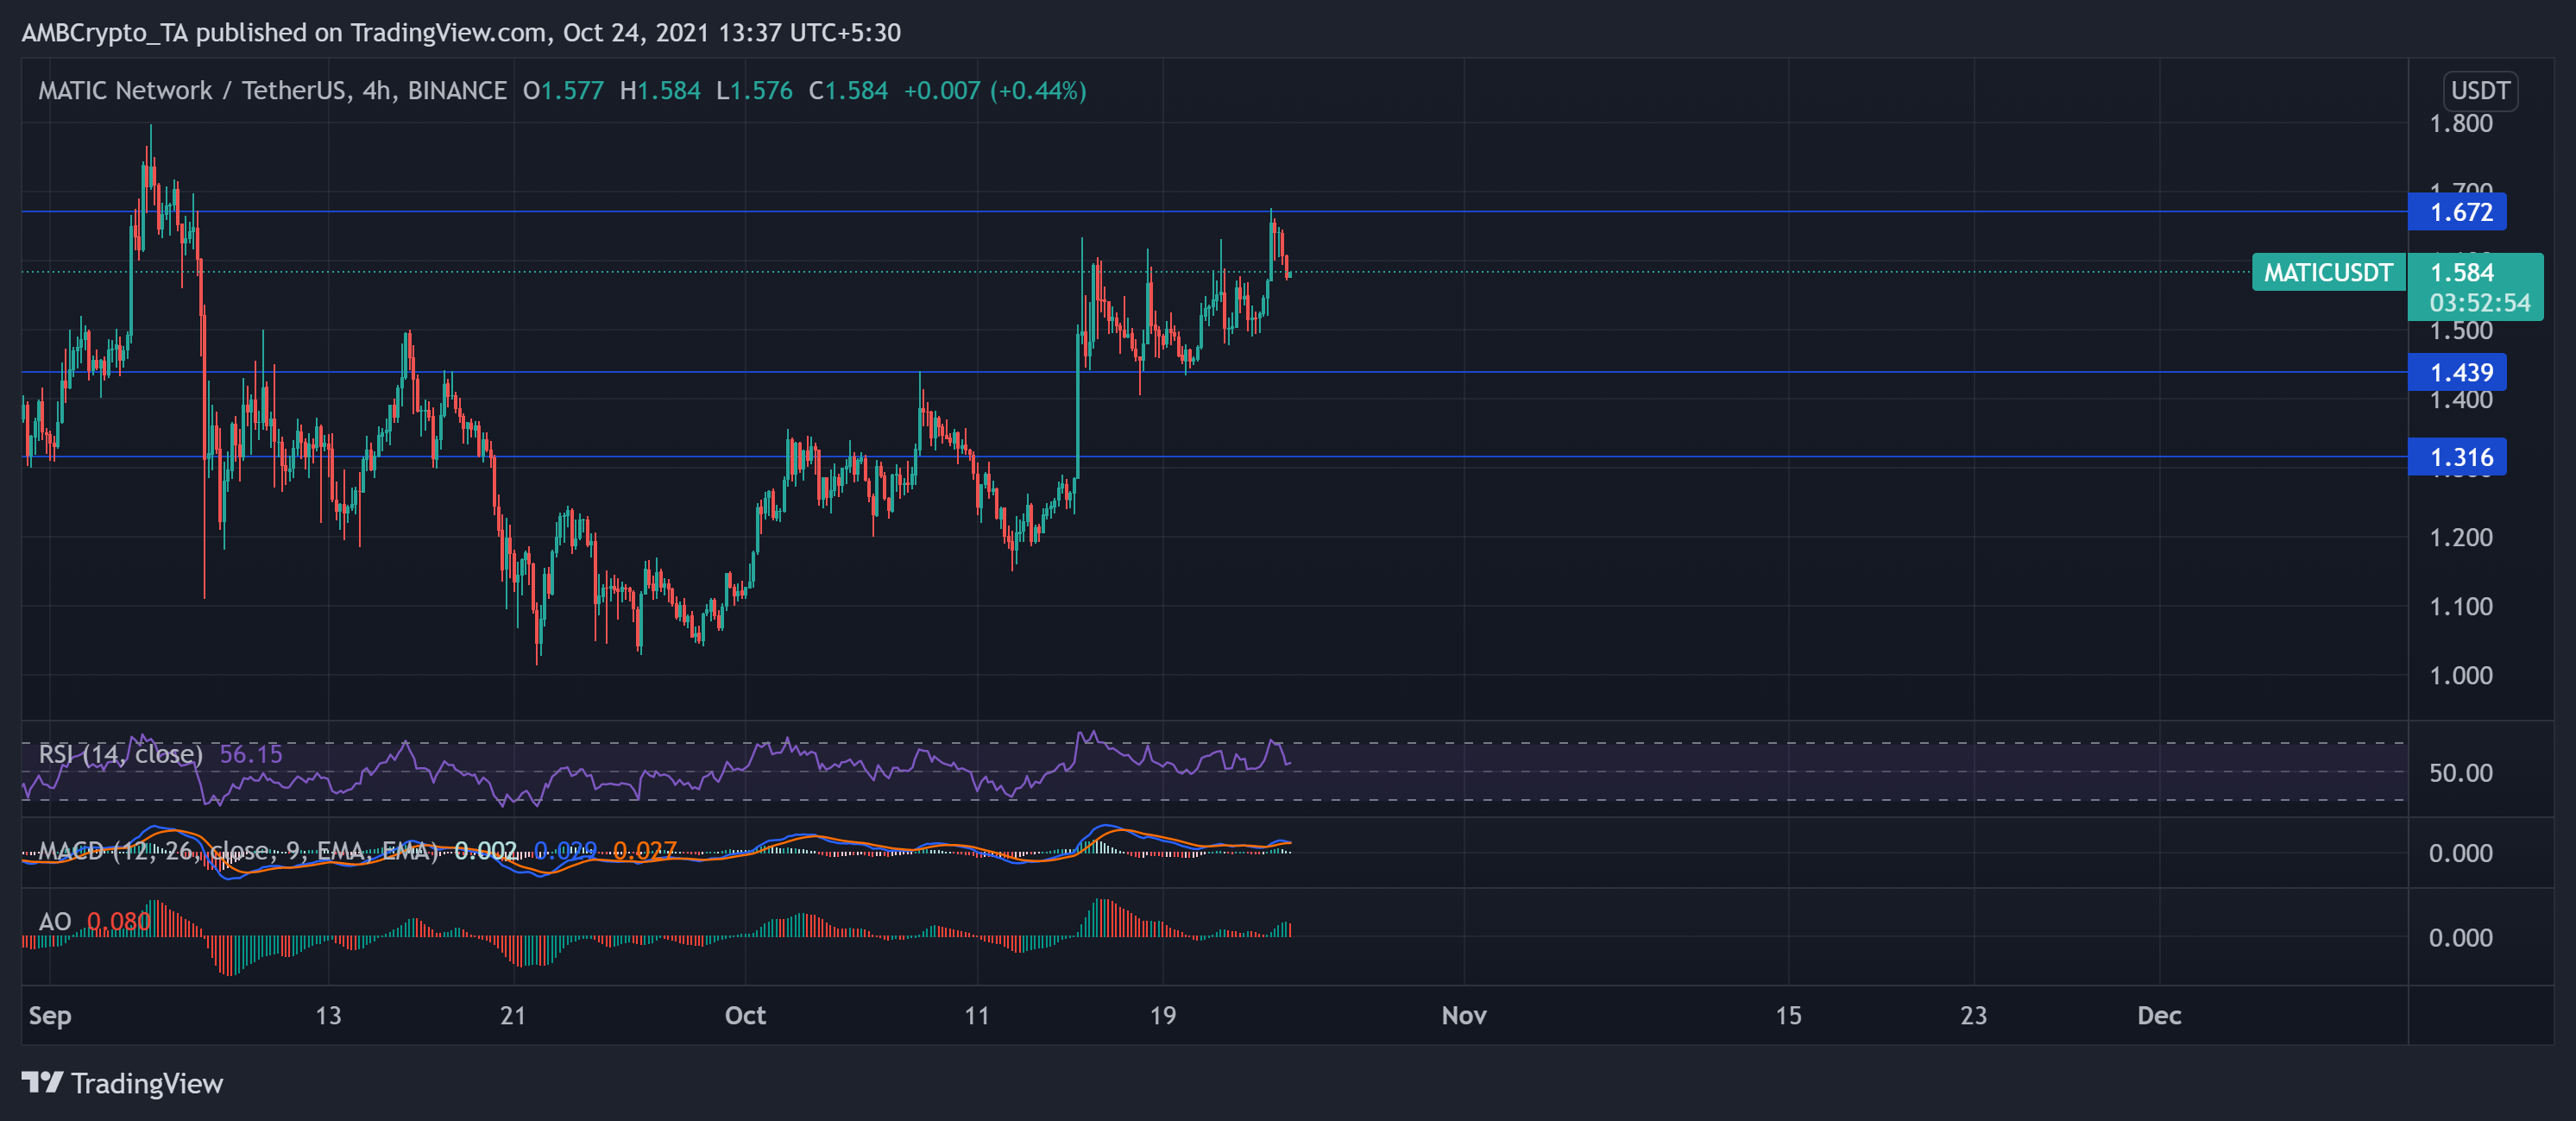
MATIC witnessed a rather bouncy price trajectory over the last ten days and oscillated within a narrow range by finding its resistance at $1.672.
Bulls displayed dominance as the altcoin hit its 6-week high on 23 October. The digital currency traded at $1.584 and noted a 2.50% gain over the last day. However, the bears seemed to have their say as key technicals favored them.
The RSI assumed a downtrend and stood at the 58-mark. Further, MACD and Signal Line hint at a bearish crossover, while the Awesome oscillator started to flash a red signal bar.


