Bitcoin Cash, Ethereum Classic, Litecoin Price Analysis : 10 June

Total market capitalization rose by 6% in the last 24 hours thanks to positive cues from the market and news. Ethereum Classic received its new Mantis update, LocalBitcoins recently added Bitcoin Cash support for payments, and Grayscale Investments Holdings freshly bought 5131 Litecoin. Regardless, the coins witnessed faint gains in the day.
Bitcoin Cash [ BCH ] :-

Source: BCH/USD – TradingView
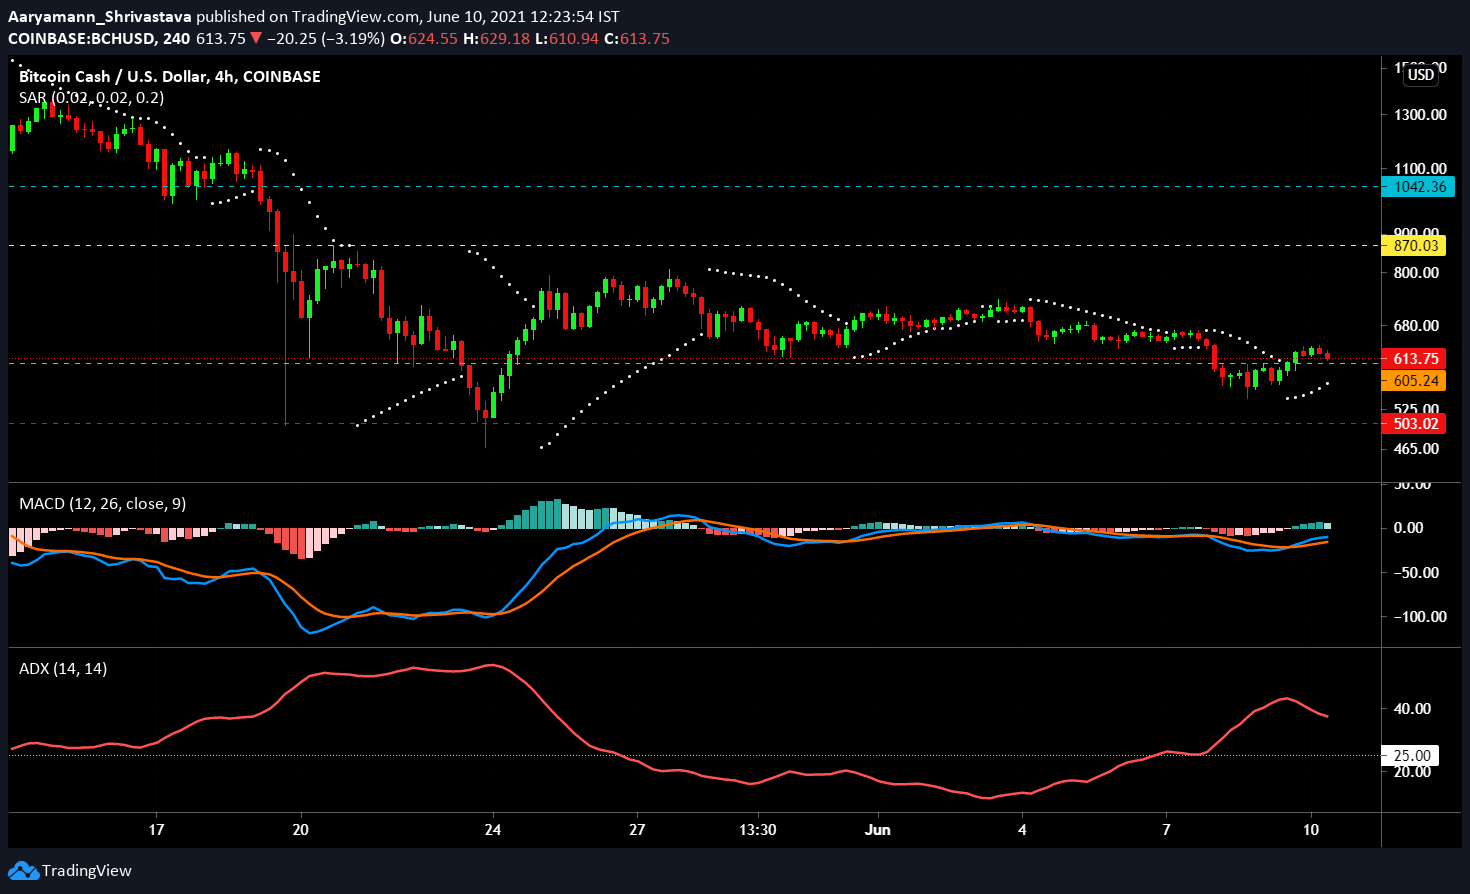
Bitcoin Cash continued to perform poorly for the second week. The coin had been repeatedly testing the $605 support level since May 28 and the June 7 dip brought it to fruition. BCH fell below the support line for a good 36 hours before coming back up on June 9. Even though Parabolic SAR displayed an active uptrend, as the white dotted lines remained below the candlesticks, the coin was dangerously close to falling again trading at $613 in red.
The rise of Average Direction Index (ADX) indicated a slight price rise 24 hours ago. At press time, this indicator was less directional which could be a bad sign for the active trend – uptrend at the moment. The bullish crossover observed on the MACD indicator could be helpful in preventing a steep price drop since the indicator line was over the signal line.
Since the coin broke active support level, the next was established at $503.
Ethereum Classic [ ETC ]:-

Source: ETC/USD – TradingView
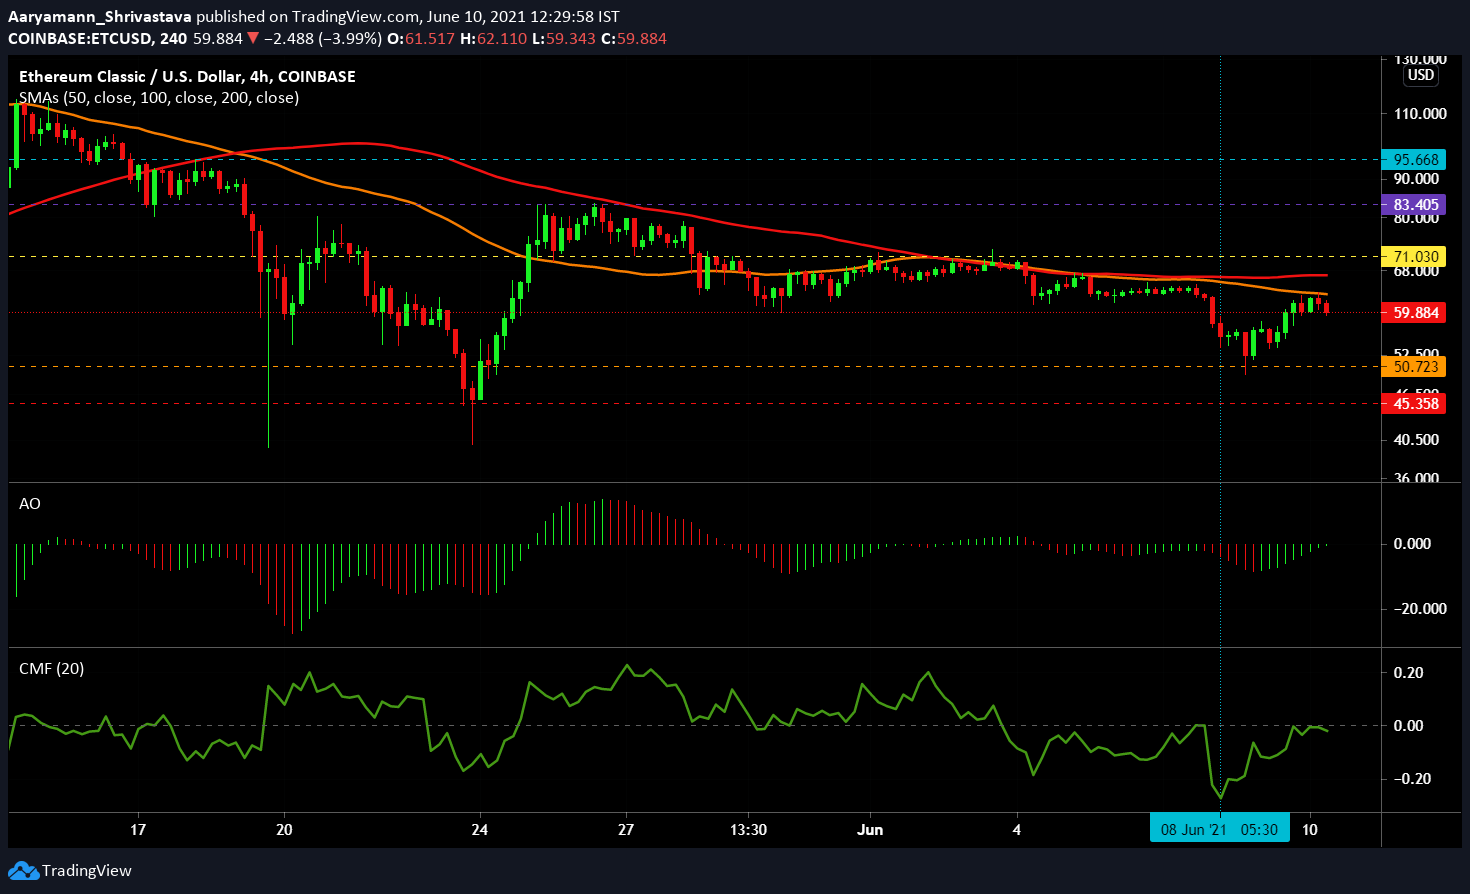
In the last 15 days, ETC has lost about 27.6% of its price to trade at $59.8. This drop created a temporary lower resistance level at $71. The Simple Moving Averages have not been favorable for the coin since the beginning of June. The lines – 50 SMA (orange) and 100 SMA (red) both remained strongly bearish on the 4-hour chart.
Awesome Oscillator displayed bearish momentum between June 8 and 9, but at press time bullish momentum could be observed on the indicator. Capital inflows had been moderately strong as they brought the Chaikin Money Flow indicator back to the neutral line. However, in the last few hours, capital outflows have been a little higher, keeping the indicator closely below the neutral line.
At press time, price movement seemed dormant but ETC will need stronger positive cues in order to break past $71.
Litecoin [ LTC ] :-

Source: LTC/USD – TradingView
Litecoin fell by 13.2% at the start of this week, but a strong recovery pushed the coin back up to $168.8 at the time of writing. $185.5 continued to act as the resistance level for LTC. Despite Squeeze Momentum Indicator exhibiting an active squeeze release ( presence of white dots ), bearish pressure could be seen receding in the last 24 hours.
After falling into the oversold zone on June 8, strong buying pressure helped Relative Strength Index (RSI) to come back up towards its 50 mark. The purple indicator however dipped slightly towards the neutral line at the time of writing.
In spite of being diverged, Bollinger Bands moved parallel to each other at press time. With no clear signs of volatility, it’s safe to consider sideways movement for the coin going forward.


