Chainlink, MATIC, Theta Price Analysis: 10 June

For alts like Chainlink, MATIC, and Theta, prices were less affected by the June 7 market fall that pulled down the total crypto market cap and affected a lot of major alts.
While Chainlink and MATIC saw sideways price movement on the four-hour chart with restricted price ranges, Theta saw minor gains from the beginning of June.
Chainlink [LINK]
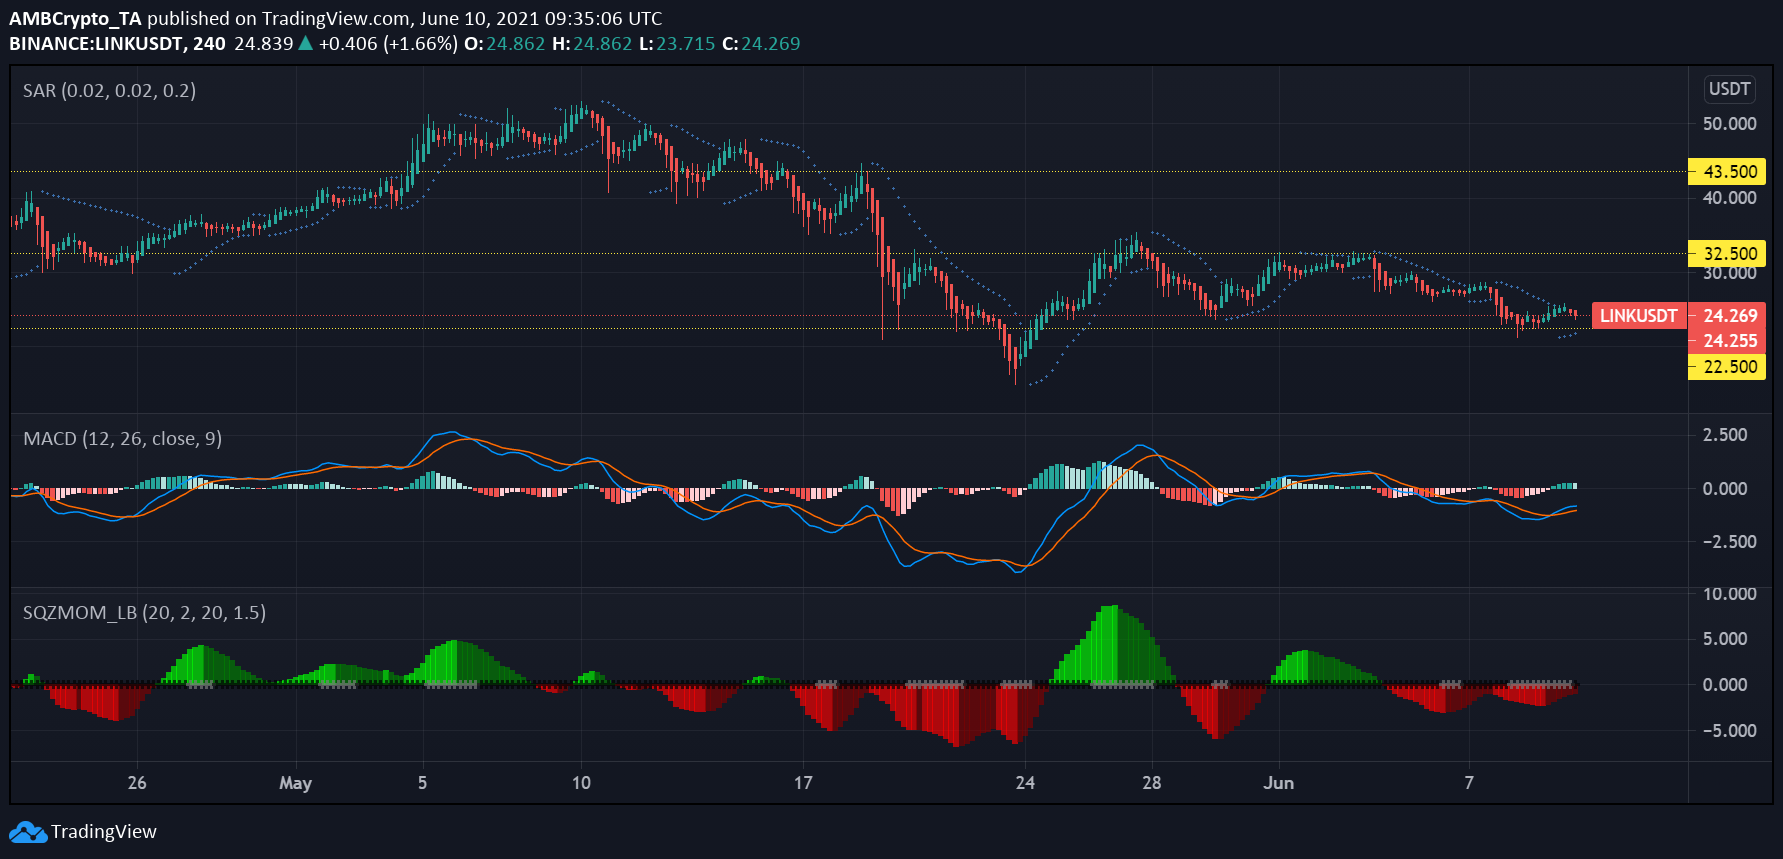
At press time, Chainlink traded at $24.2 and oscillated close to the support at $22.5. Even though the asset’s popularity dropped, its price showed steady developments.
On a four-hour chart, LINK underwent a bullish crossover on June 9, as MACD lines inched closer to the signal line from below. The asset was still in the bearish zone but signs of improvement can be observed. This corresponded with Parabolic SAR as its dotted lines appeared below the candlesticks highlighting a bullish momentum.
Even though the asset was down 53.02% from its all-time high, in the last two days, it saw a price gain of around 15%. Further, Squeeze Momentum Indicator highlighted a receding bearish pressure. With the recent ‘Squeeze release’ indicated by white dots and the appearance of the dark red bars, the momentum could turn positive.
Polygon [MATIC]
MATIC went down by almost 30% from the beginning of June, the asset held the 17th spot on CoinMarketCap and its 24-hour price rise was 1.15%. While the asset was down 44.66% from its all-time high, in the last 30 days its ROI, vs USD was +32.99%.
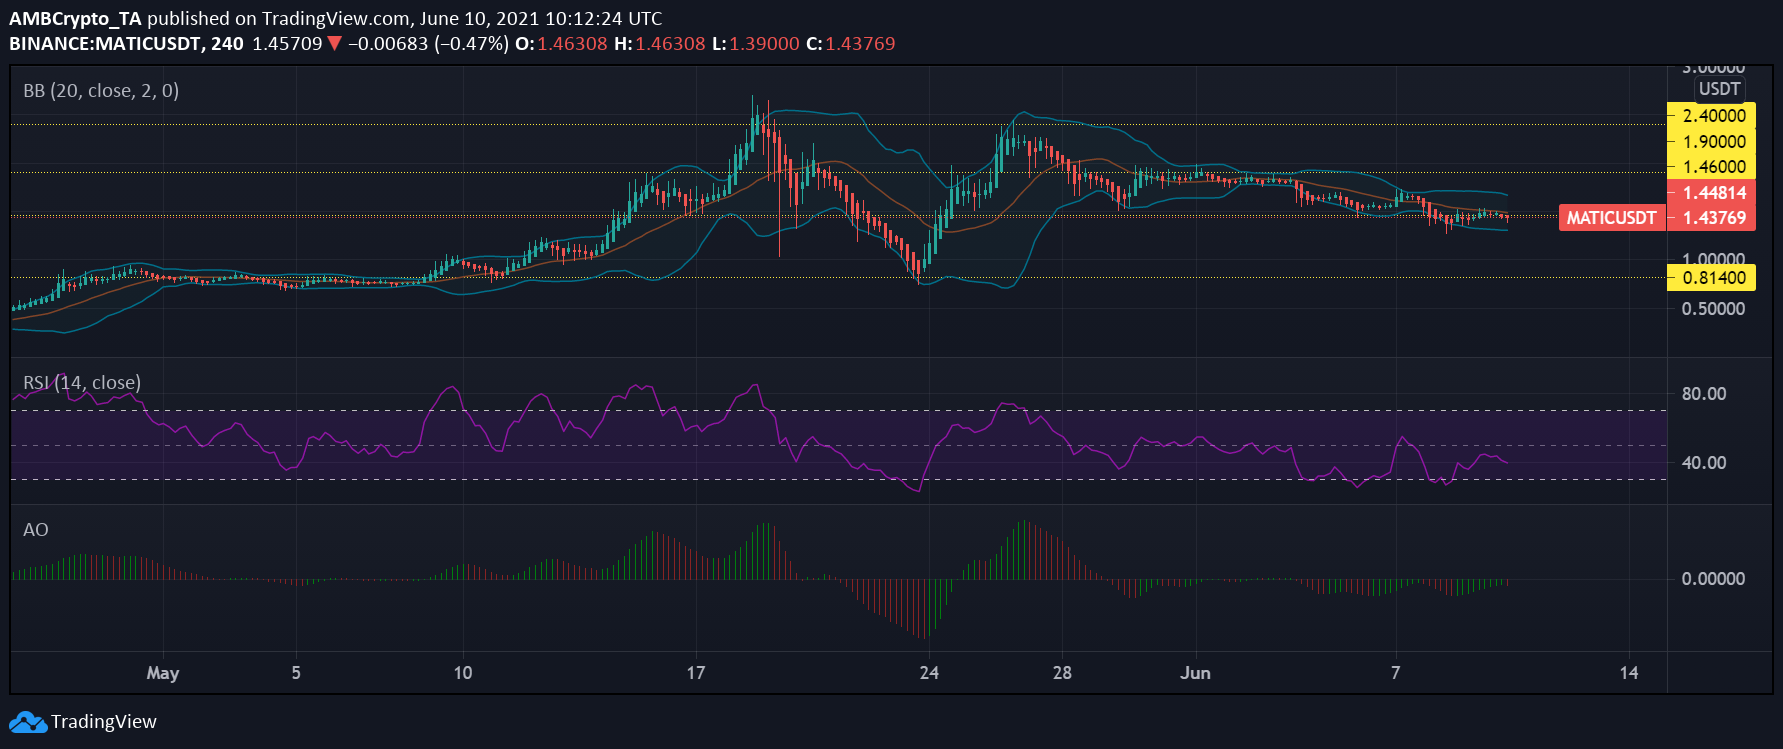
Bollinger Bands for the altcoin depicted a steady parallel movement, indicating that market action was low. At press time on a four-hour chart, candlesticks for MATIC tested the $1.46 mark multiple times, if the price falls further below, the next key support was at $0.814.
Relative Strength Index for the asset highlighted that even though it was in the neutral zone, oscillating between 35-45, selling pressure was pushing in depicted by the downward trajectory of the indicator. Further, Awesome Oscillator suggested that bearish momentum was creeping in for the asset which could move the price down.
Theta[THETA]

Ahead of Theta’s mainnet 3.0 launch scheduled for June 30, the altcoin’s price went up by almost 40% since the beginning of June. While the asset’s price has been moving in close proximity to the resistance mark at $9.95, it struggled to break through. At press time, Theta traded at $9.0 and held the 18th position on CoinMarketCap.
Chaikin Money Flow’s indicator maintained above the zero-line highlighting that inflows dominated outflows. A slight uptick of the indicator at press time suggested that cash inflow pressure was increasing. However, the red candlesticks at press time highlighted a 7% price dip from June 9.
Further, MACD lines were in close proximity to each other slightly above the signal line, this could move the asset into a moderately bearish momentum, thereby pushing the price further down.