Bitcoin Cash: Has BCH’s rally reached its zenith?
Bitcoin Cash's significant rally seems to have plateaued after price rejection at new resistance level.

Disclaimer: The information presented does not constitute financial, investment, trading, or other types of advice and is solely the writer’s opinion.
- Bitcoin Cash’s [BCH] bullish momentum was halted by critical retracement.
- A negative funding rate could extend retracement.
Bitcoin Cash’s [BCH] remarkable three weeks rally from the depths of $100 to the heights of $330 seems to have plateaued in recent days. A key retracement has stalled the bullish momentum after registering over 200% gains within the aforementioned period.
Read Bitcoin Cash’s [BCH] Price Prediction 2023-24
As of press time, Bitcoin [BTC] had dipped to $30.2k from $31.1k. This left BCH traders with a tough decision to make – look for new long positions based on the retracement or ride the dip down to a key support level.
Is this the long-awaited retracement for BCH?
Price movements are never linear. While BCH achieved its bullish run with a series of higher lows, it was only a matter of time before a significant retracement occurred.
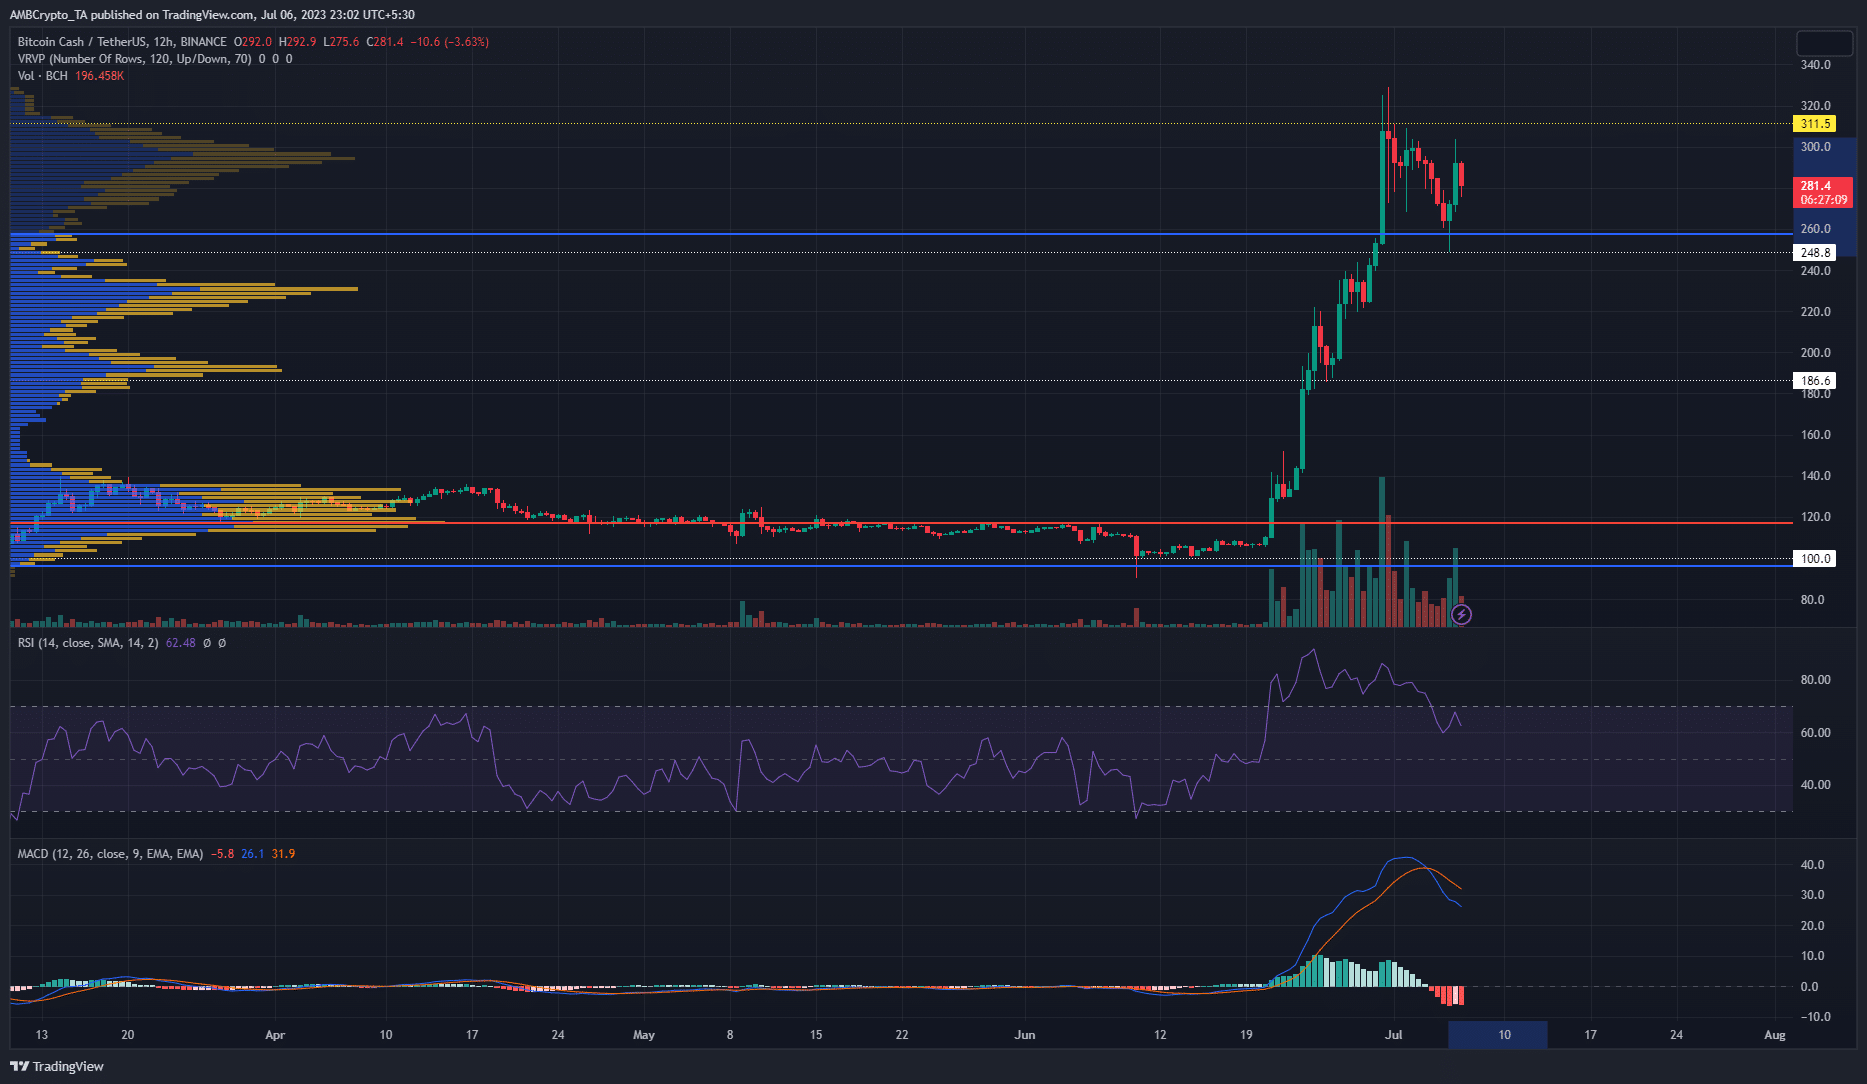
The Visible Range Volume Profile gave insight into where the main price action moves were happening. The Volume Area Low (VAL) and Point of Control (POC) lay close to each other at $96 and $120 respectively. However, the Value Area High (VAH) played a key role in the current retracement.
After the price was rejected at the $311 resistance level, buyers quickly found support at the VAH ($260) which lay close to the support level at $248. This led to a 23% price bounce from this level. Despite this bounce, BCH was making another decline toward the $248 support, as of press time.
With the Relative Strength Index (RSI) dipping out of the overbought zone and the Moving Average Convergence Divergence (MACD) posting a bearish crossover along with red bars below zero, the bullish demand could be waning.
Another positive reaction by bulls would be if the price gets to the VAH and support level confluence could provide new long opportunities. On the other hand, a break below the level could lead to a deeper retracement with targets at $220 – $200.
Negative Funding Rate doesn’t look good for bulls
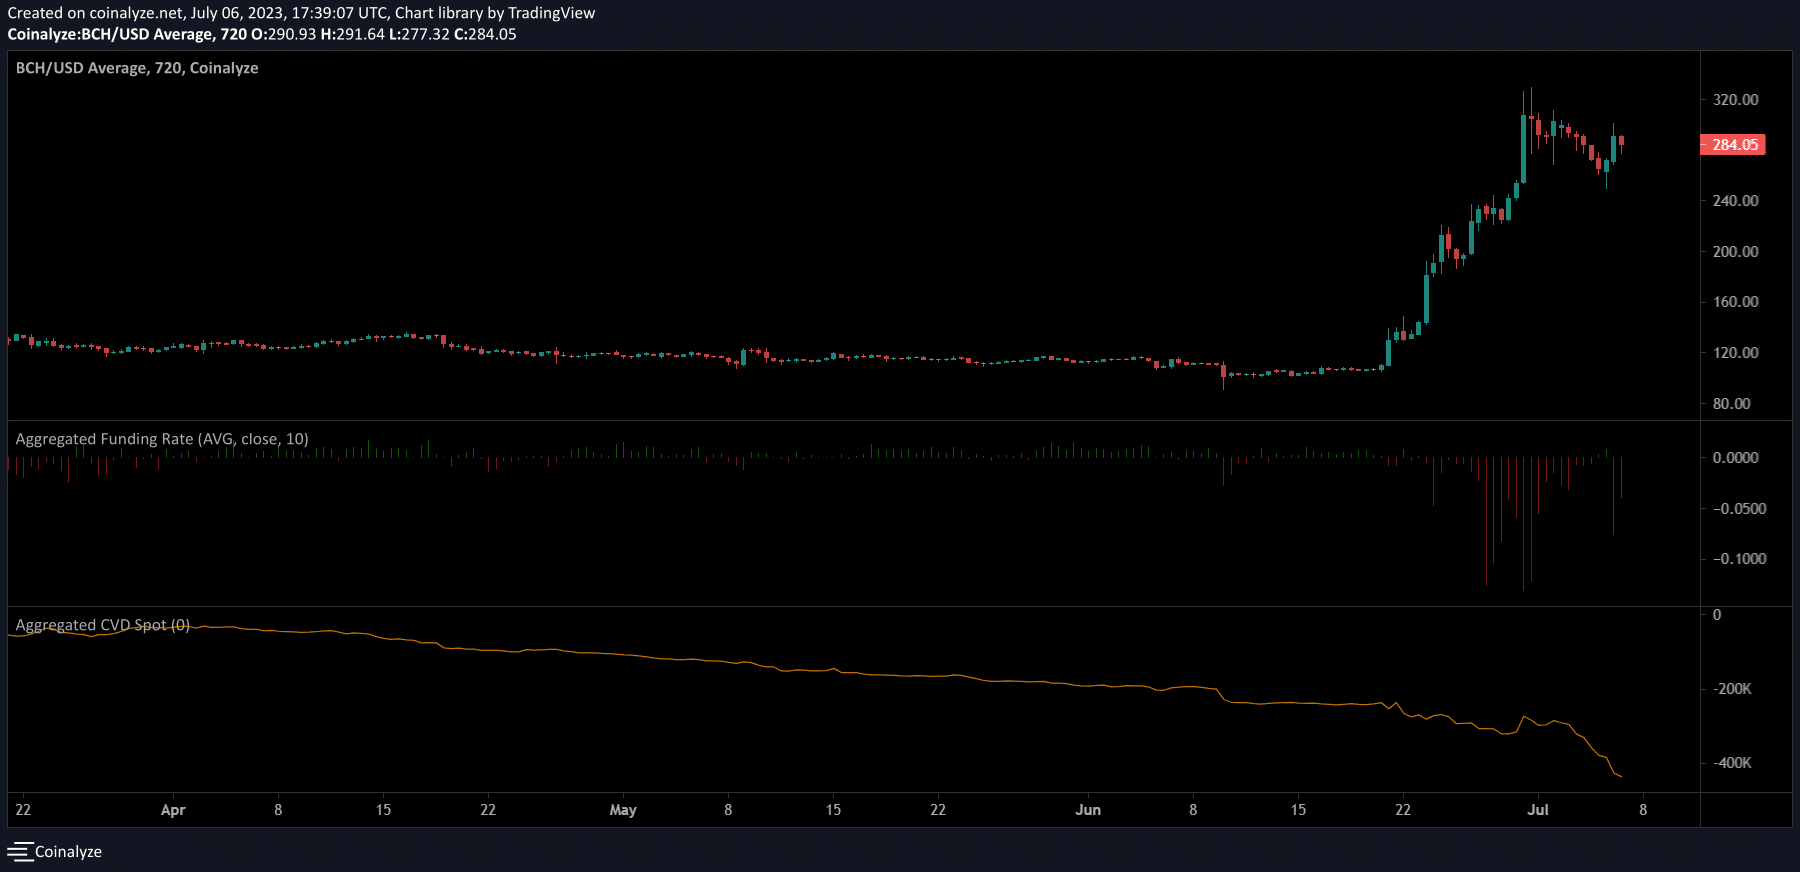
Typically, the Funding Rate tends to correlate with the mid to long-term trend of the asset. Negative funding rates encourage traders to go short in the futures market. Per Coinalyze, BCH has posted negative funding rates since 27 June on the 12-hour timeframe. This could increase the likelihood of a deeper retracement for BCH.
Realistic or not, here’s BCH’s market cap in BTC terms
Similarly, the Spot CVD dipped sharply from 30 June. This revealed there was more capital outflow than inflow into BCH. Together, it suggested traders adopt a cautious approach in the mid to long term.