Bitcoin Cash, IOTA, Ethereum Price Analysis: 29 May

Bitcoin’s retracement back towards $35,000 injected bearish sentiment into the global cryptocurrency market. Altcoins such as Ethereum, Bitcoin Cash, and IOTA remained below their resistance levels and chances of a further pullback loomed large.
Bitcoin Cash [BCH]
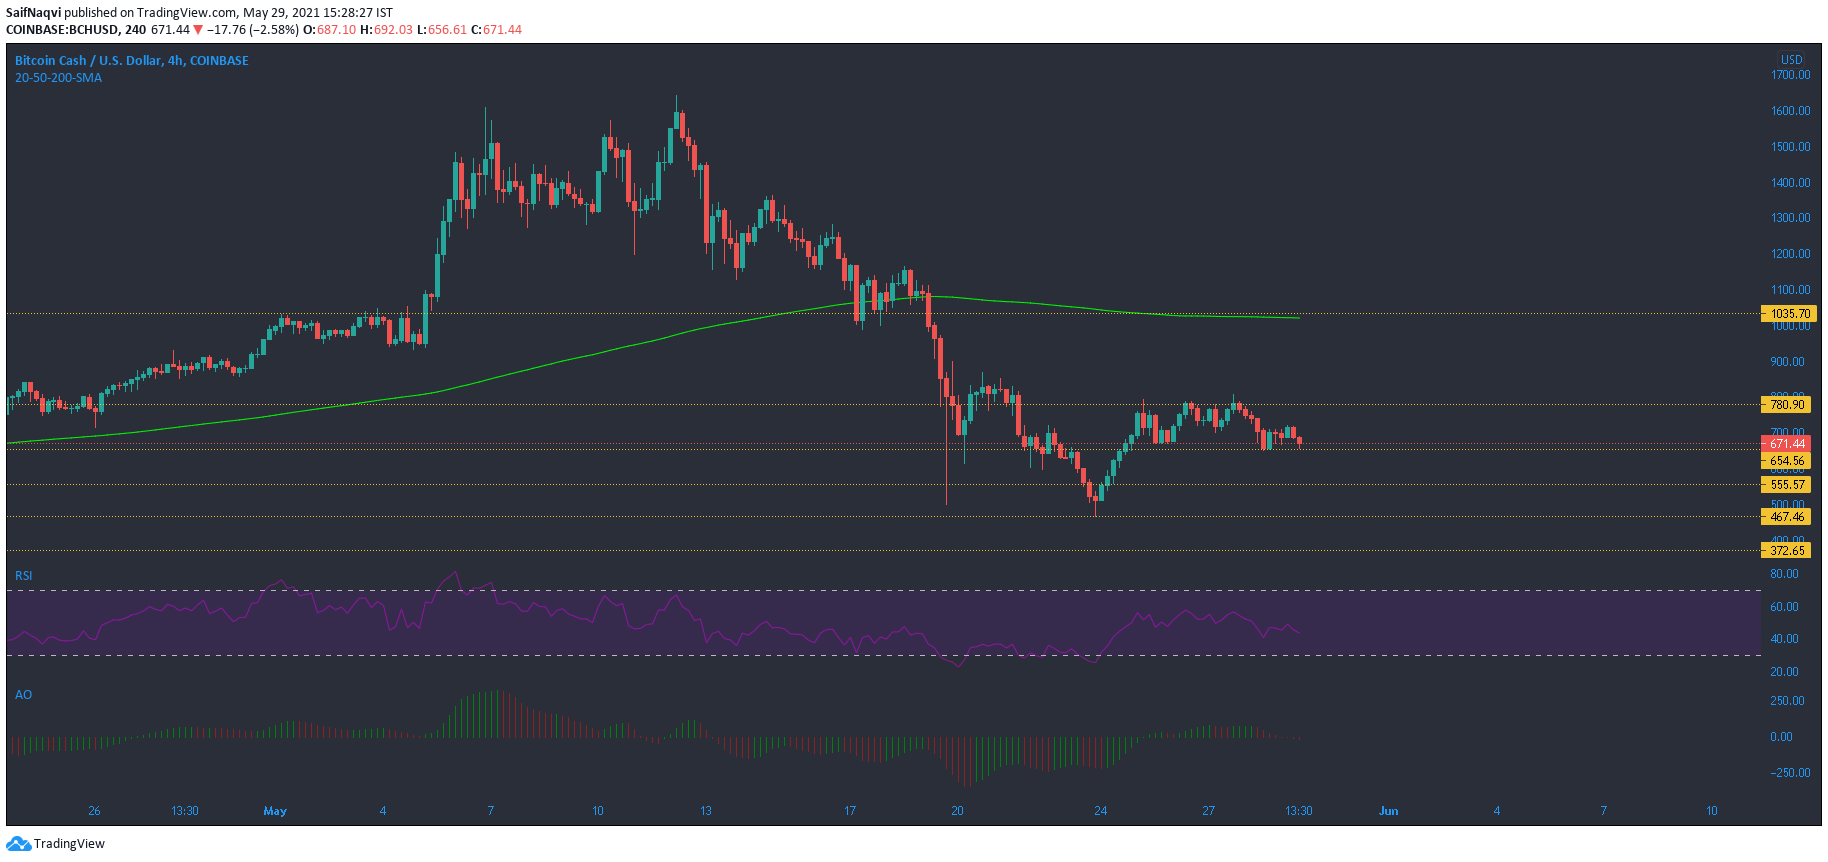
Bitcoin Cash’s pullback in late February showed a sell-off from the channel $780-650 to $467-372. Interestingly, these areas were in the spotlight over the last few days as well. The region between $780-$650 has already acted as a supply zone in the past and failing to break above this channel could lead to yet another breakdown.
If the aforementioned levels are also breached, BCH would likely move towards $203-$272 in extremely bearish conditions. On the other hand, a breakout could culminate into a 30% price jump towards the 200-SMA (green), but stronger cues were needed for such a move.
The RSI was expected to recover steadily since bouncing back from the oversold zone, but it failed to move above 56-57. A downtrend could see it head back towards the lower zone once again. According to the Awesome Oscillator, momentum was bearish-neutral.
IOTA

IOTA maintained its movement between the channel of $1.28-$0.96, at the time of writing. However, its technicals presented a bearish outcome and the focus would likely be on support lines moving forward. In case of a breakdown, a newly discovered demand zone lay between $0.80 to $0.662 and buyers could re-enter the market here. Another buy region lay between $0.508 and $0.347, but only a severe sell-off would highlight this point of contact.
The Squeeze Momentum Indicator registered a series of red bars, but the black dots indicated a market squeeze. If the dots switched to white, expect sharper losses over the coming sessions. The MACD line continued to move south after highlighting a bearish divergence.
Ethereum [ETH]
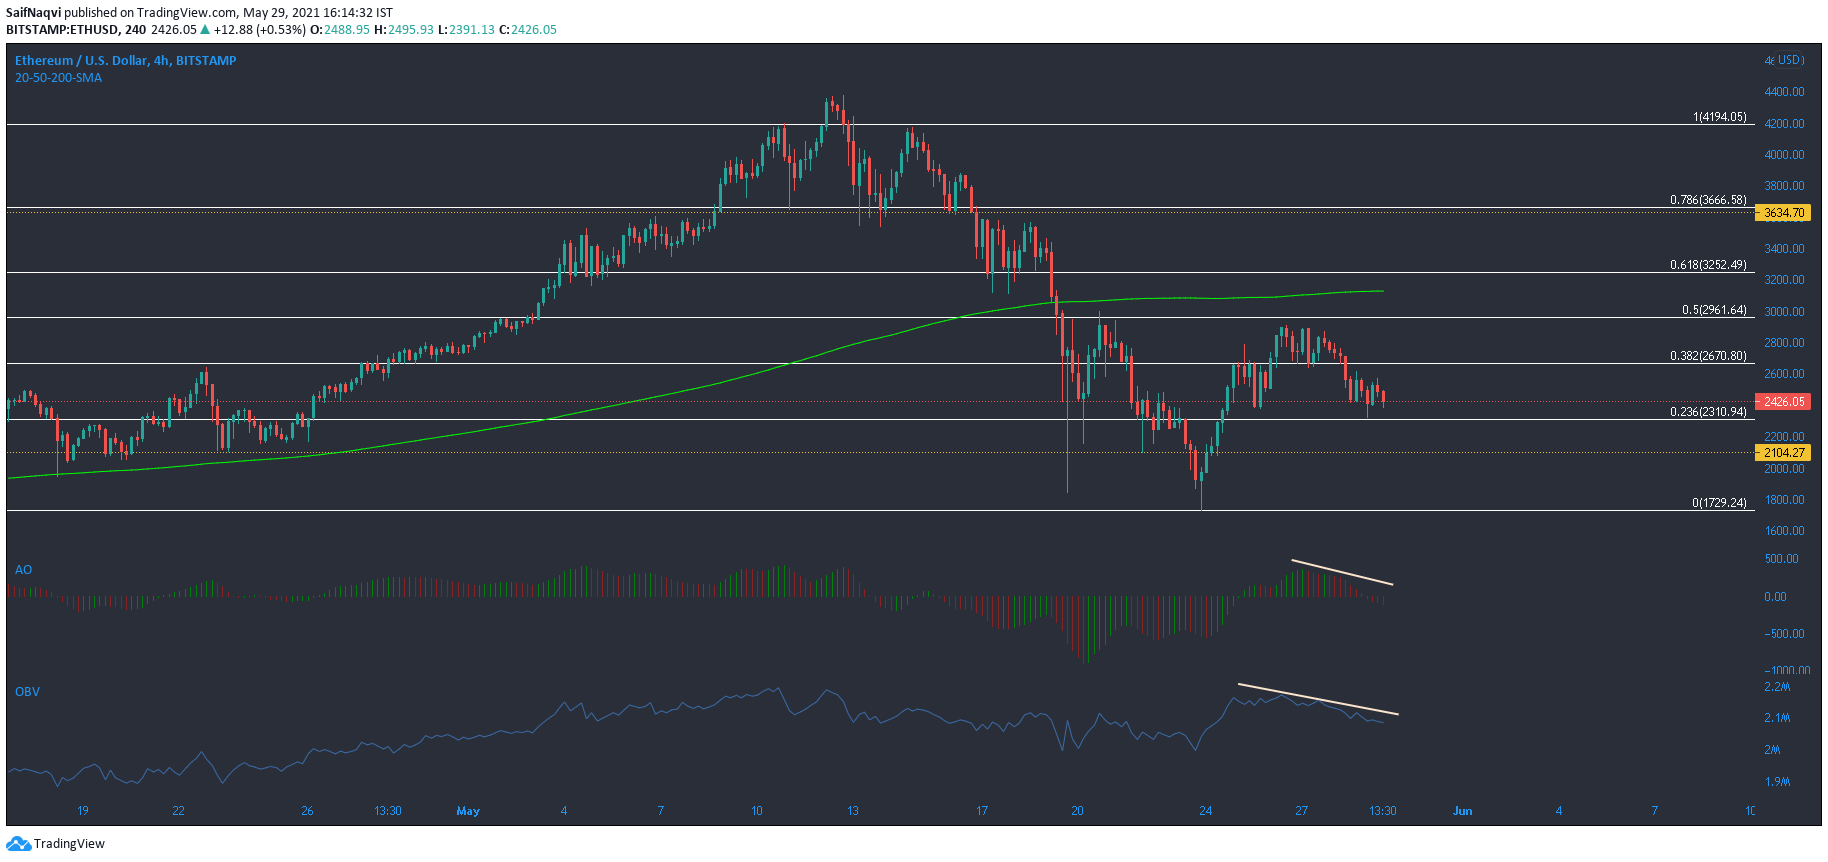
Sellers returned to the Ethereum market after denying a breakout above the 50% Fibonacci level ($2,916). On the 4-hour chart, ETH headed towards the 23.6% Fib level ($2,310) and a breakdown would highlight the next defensive area between $2,104 and $1,729.
However, bulls must be wary of a move below from this channel as it could trigger another 23% drop between $750-$850. Overall, this outcome would result in a 65% retracement from the press time price level. If BTC concedes $30,000 to the bears, ETH would be under the pump as well.
The Awesome Oscillator’s red bars highlighted momentum behind the sellers. The OBV’s southbound trajectory showed that selling pressure outmatched buying pressure – A situation that was likely to last over the coming day well.