Bitcoin Cash, Monero, Cosmos Price Analysis: 14 May

Ethereum’s resurgence towards the $4,000-mark was accompanied by renewed interest among most alts in the broader market, even though Bitcoin was languishing around $50,000, at the time of writing. Bitcoin Cash, Monero, and Cosmos found support at different levels on their respective charts and targeted a bullish U-turn.
Bitcoin Cash [BCH]

Source: BCH/USD, TradingView
Even though Bitcoin Cash registered losses along with most alts over the past couple of days, the broader market dynamics seemed to shift once again, at the time of writing. With Ethereum eyeing a comeback above $4,000, large-cap alts, including BCH, could see a shift in narrative once again.
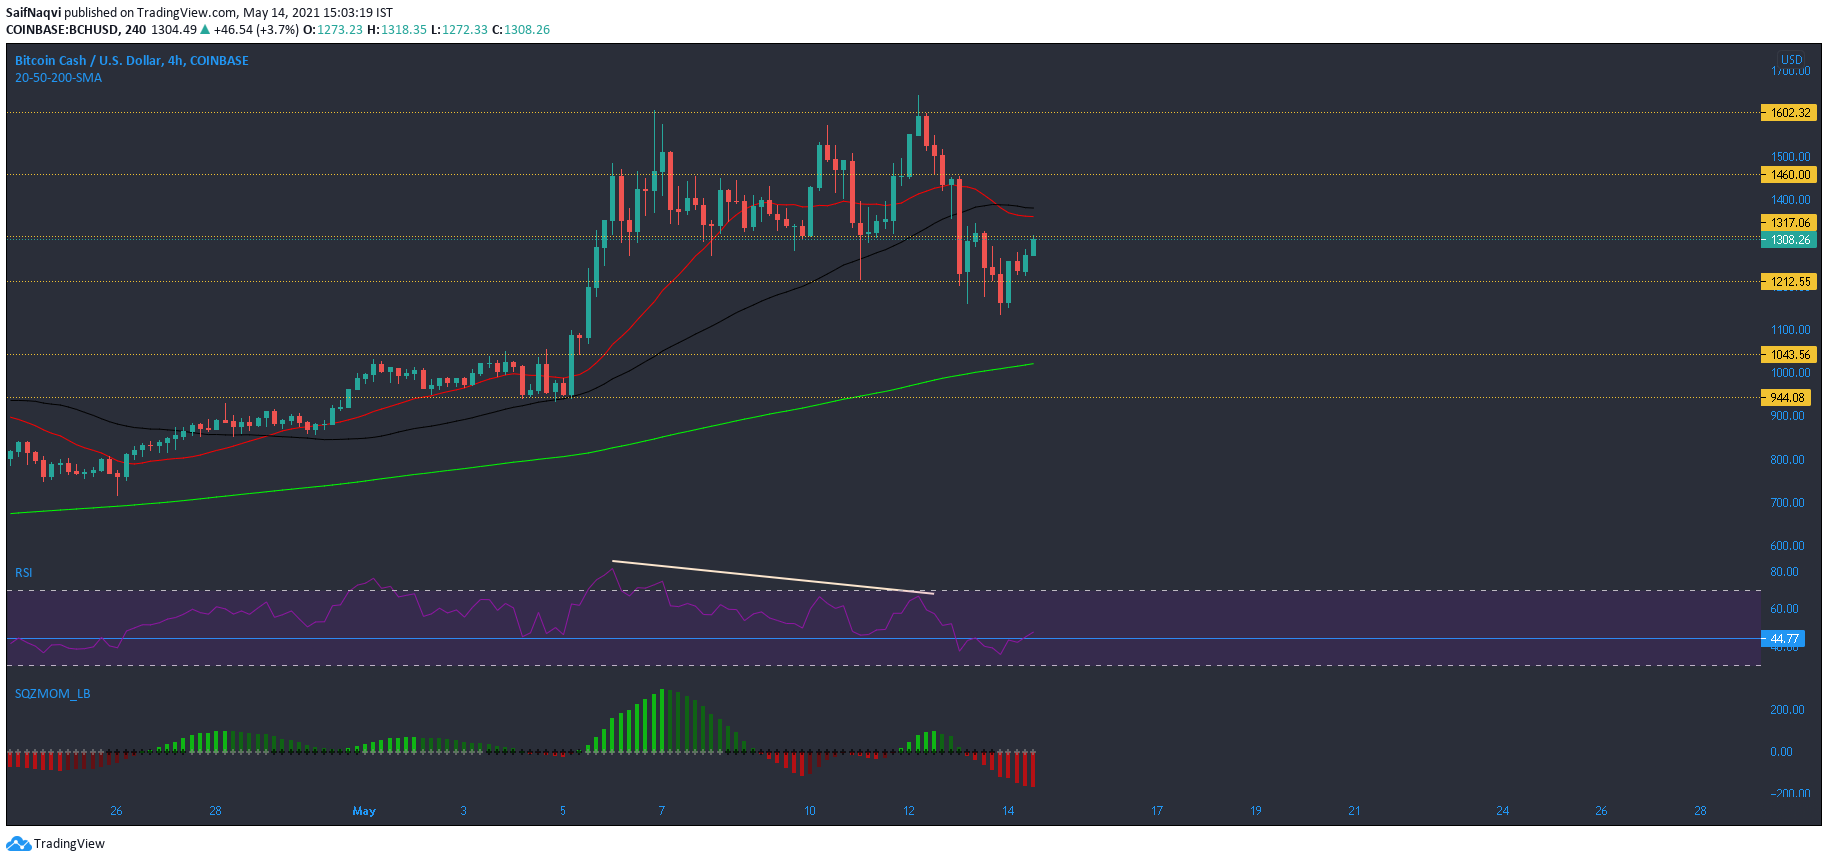
On the 4-hour charts, BCH slipped below its 20-SMA (blue) and 50-SMA (yellow), but buying picked up around $1,140. It would be interesting to see if bulls can push the price above its short and mid-term moving averages. The SMAs moved in a resistance area present between $1,460 and $1,317. Reclaiming this zone would allow for a comeback above $1,600.
A bearish divergence was spotted on the RSI after which BCH dropped towards $1,140. Since mid-April, the 44-45 region has acted as resistance/support for the RSI. A rise above this resistance is a positive sign in the market. Conversely, the Squeeze Momentum Indicator noted selling momentum, but the first dark red bar would indicate weakening on the bearish side.
Monero [XMR]

Source: XMR/USD, TradingView
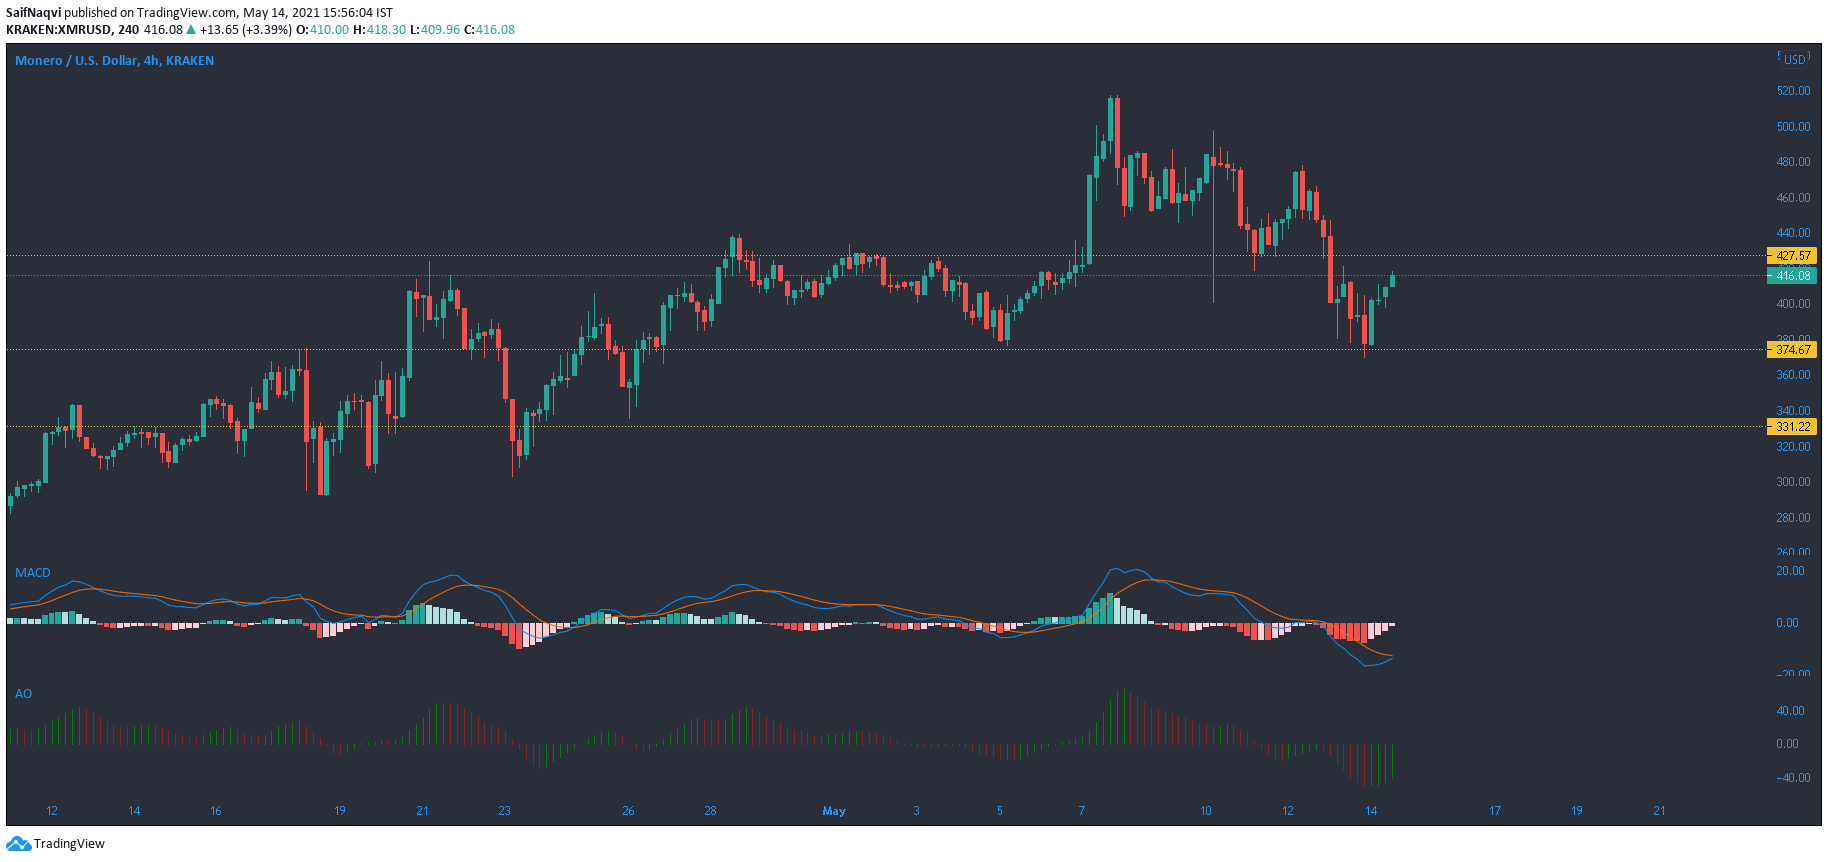
Monero trimmed its losses at a buy zone present between $427.5 and $374.6. This area was supported by the 200-SMA (green) and formed a strong line of defense. A hike above the upper ceiling and the 50-SMA would likely instigate a bullish comeback, but some bearish conditions still persisted in the market.
The MACD, close to a bullish crossover, was well below the half-line and in negative territory. The last time the MACD found itself in such a spot was during the late February broader market correction. The Awesome Oscillator registered a series of green bars as buying pressure was on the rise.
Cosmos [ATOM]

Source: ATOM/USD, TradingView
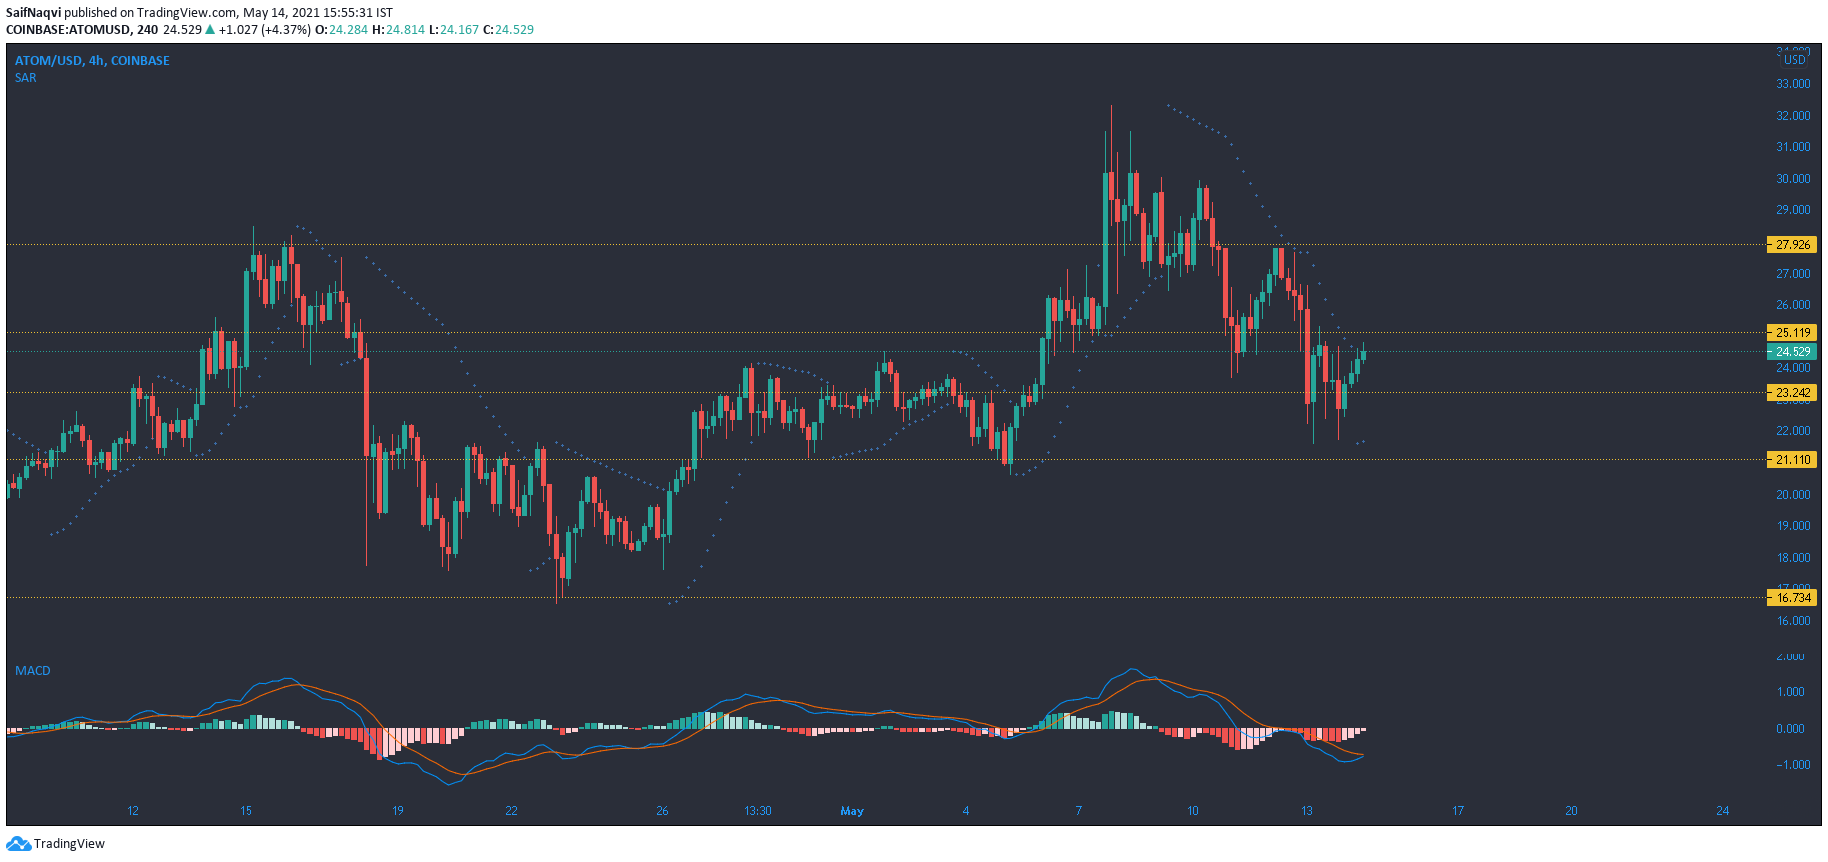
A previous analysis on Cosmos mentioned a reliable support area between $21 and $23. Hence, its movement on the 4-hour chart came as no surprise when buyers stepped in around this level. If buying pressure can boost ATOM above two crucial resistance barriers at $25 and $27.0, a rise above its ATH could be well and truly on the cards. However, this would largely depend on broader market cues and in particular – Ethereum’s movement. In case of further dips, additional support lines lay at $21.1 and further down at $16.7.
A bullish crossover in the MACD lent weight to a favorable outcome, but volumes were not there yet for a sustained rally. The Parabolic SAR’s dotted markers lined up beneath the candlesticks and suggested that ATOM was now on an uptrend.


