
Disclaimer: The findings of the following analysis are the sole opinions of the writer and should not be taken as advice
Until a few weeks ago, Bitcoin Cash was plateauing above the $700-mark on the charts. Following a week of indecision, however, BCH sharply dropped back under $540, with the altcoin spending the last two weeks trying to climb past this level once more.
Developments such as Google Finance recognizing cryptocurrencies by adding a crypto-data tab were welcome news in the industry after Bitcoin attempted to recover from its dip to $43,000. As a major alt, Bitcoin Cash is likely to be heavily influenced by the movement of the king coin.
Bitcoin Cash 12-hour chart
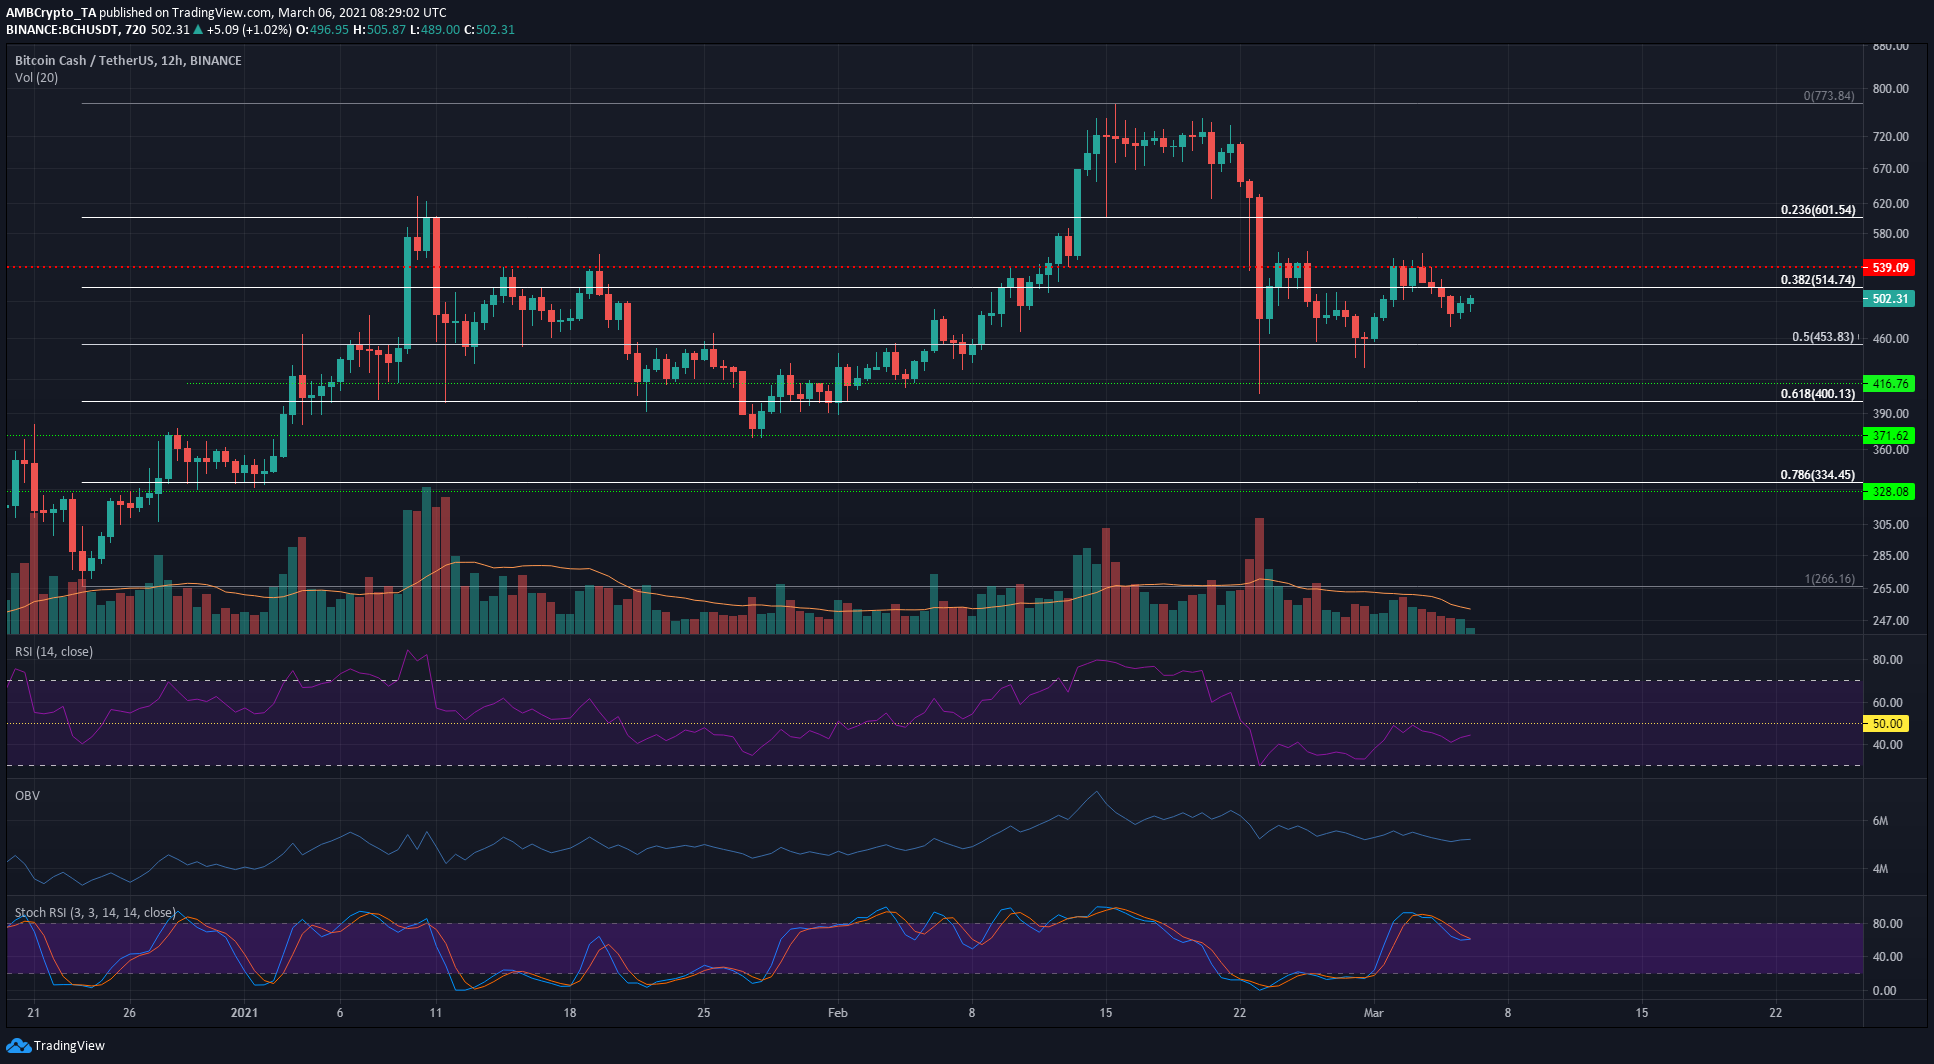
Source: BCH/USDT on TradingView
The $540-level stood resolute in resistance to demand from buyers after Bitcoin Cash dropped to $460. The long-term outlook for Bitcoin Cash remained bullish at press time, yet the $460 and $540-levels were very important levels for Bitcoin Cash in either direction of where it was trading, at $502.
At the time of writing, entering the market was sub-optimal in terms of risk-to-reward. The market had not yet decided on the direction of its next move. However, the long-term trend remained bullish as a series of higher lows were set. Repeated tests of the $540-level over the next few days would likely see a breakout upwards.
It must be noted though that the next few days will see some choppiness from the market. A clear direction can emerge either after a breakout past $540, or a breakdown under $470.
Reasoning
Over the past two weeks, BCH has tested the $540-mark and been rejected, but it formed higher lows. Its trading volume was falling over this time period, indicative of an ascending triangle pattern that could see a move to $620, but only if $540 is breached and the said breach is sustained.
The technical indicators showed some bearish momentum and seller dominance behind BCH though. The RSI was moving under 50, while the OBV has also been on a downtrend since mid-February. The Stochastic RSI was also correcting from the overbought zone.
Important levels
A breakout past, and retest of, the $540-level can be used to enter a long position with a target of $600 and a stop-loss at $507, for an RR of 1.82. Trading volume must also be higher-than-average on the breakout to confirm the move.
Conclusion
A breakout past $540 is possible, while a dip under $480 would see BCH move to $450. A more aggressive trade would be to wait for a dip to $490 to enter a long position with a tight stop-loss of $479, targeting $535-$540.