Bitcoin Cash Price Analysis: 23 December

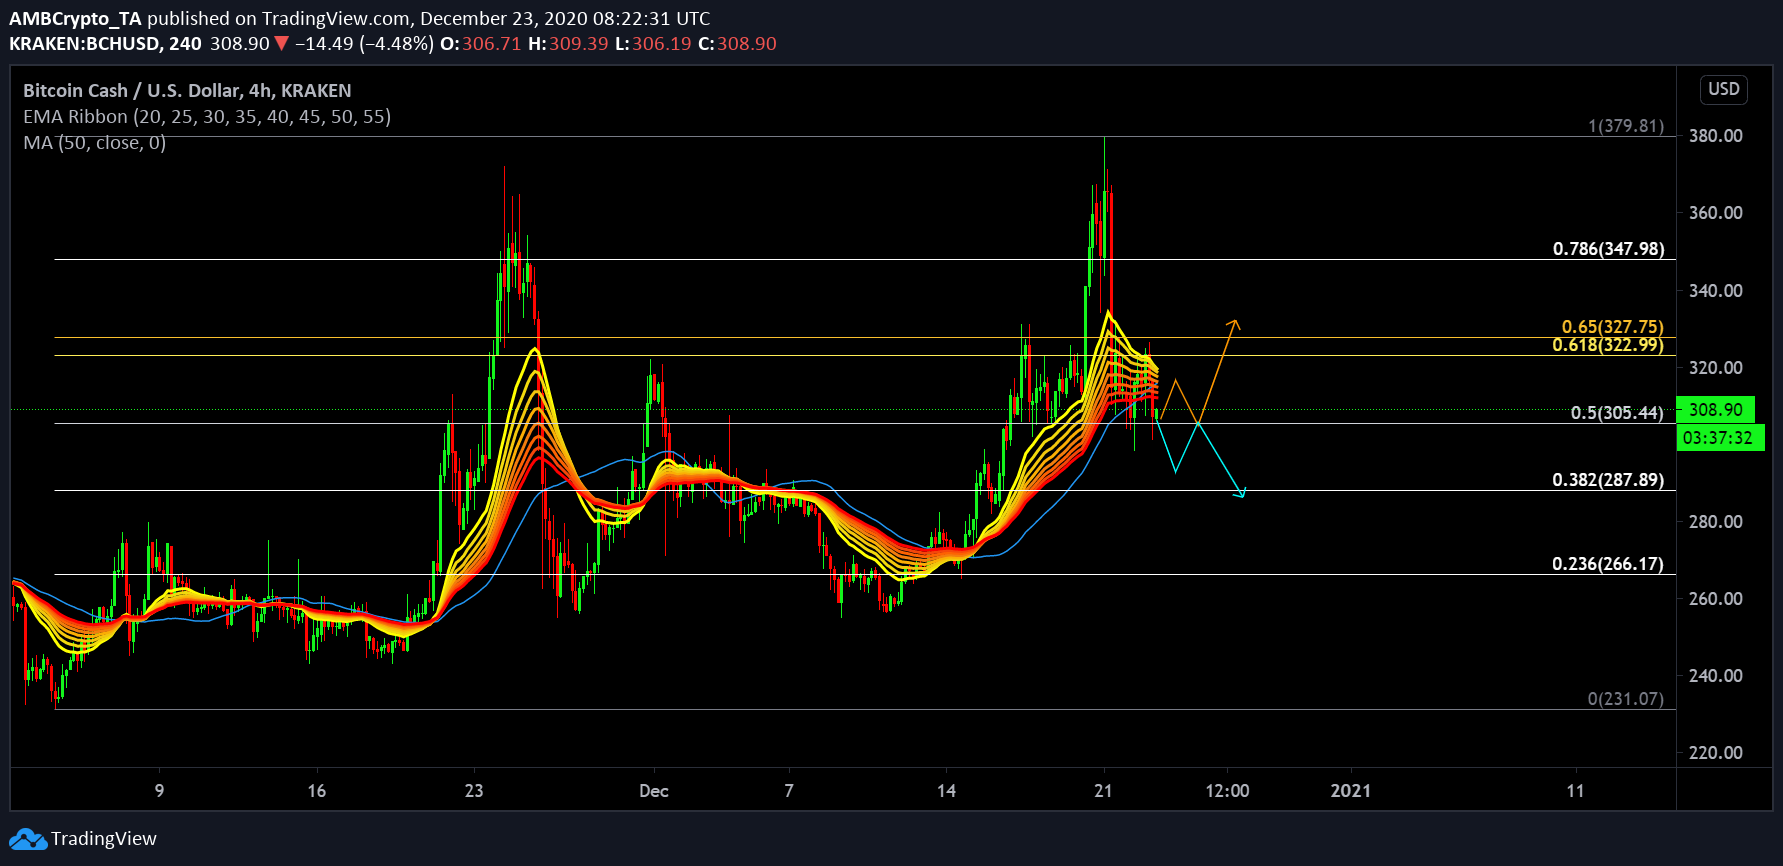
Bitcoin Cash is currently facing a period of sideways movement in the chart. The asset moved to $379 on 21st December, but a strong bearish onslaught declined its valuation down to $308.
While a key pair of supports were breached in the process, the uncertainty in the short-term chart remains evident for Bitcoin Cash, as the token might face an immediate recovery or further correction in the market. At press time, Bitcoin Cash had a market cap of $5.7 billion at press time and ranked 6th in the charts.
Bitcoin Cash 4-hour chart

BCH/USD on Trading View
The highs and lows identified on Bitcoin Cash’s chart have been extremely identical since late November, An intermediate range of $266 and $347 has been largely maintained but after Bitcoin reached its new ATH, there should have been certain changes.
Bitcoin Cash has lost traction from the collective market, and its recent decline is an example of weak correlation with Bitcoin. Currently hovering just over the support of $308, BCH may move in one of the directions indicated by the arrow paths.
A bullish recovery will see the asset bounce back towards $347 but another period of corrections may register another low near $287. The 50-Moving Average currently remained above the price candles, inclining towards a bearish trading session.
Market Rationale

BCH/USD on Trading View
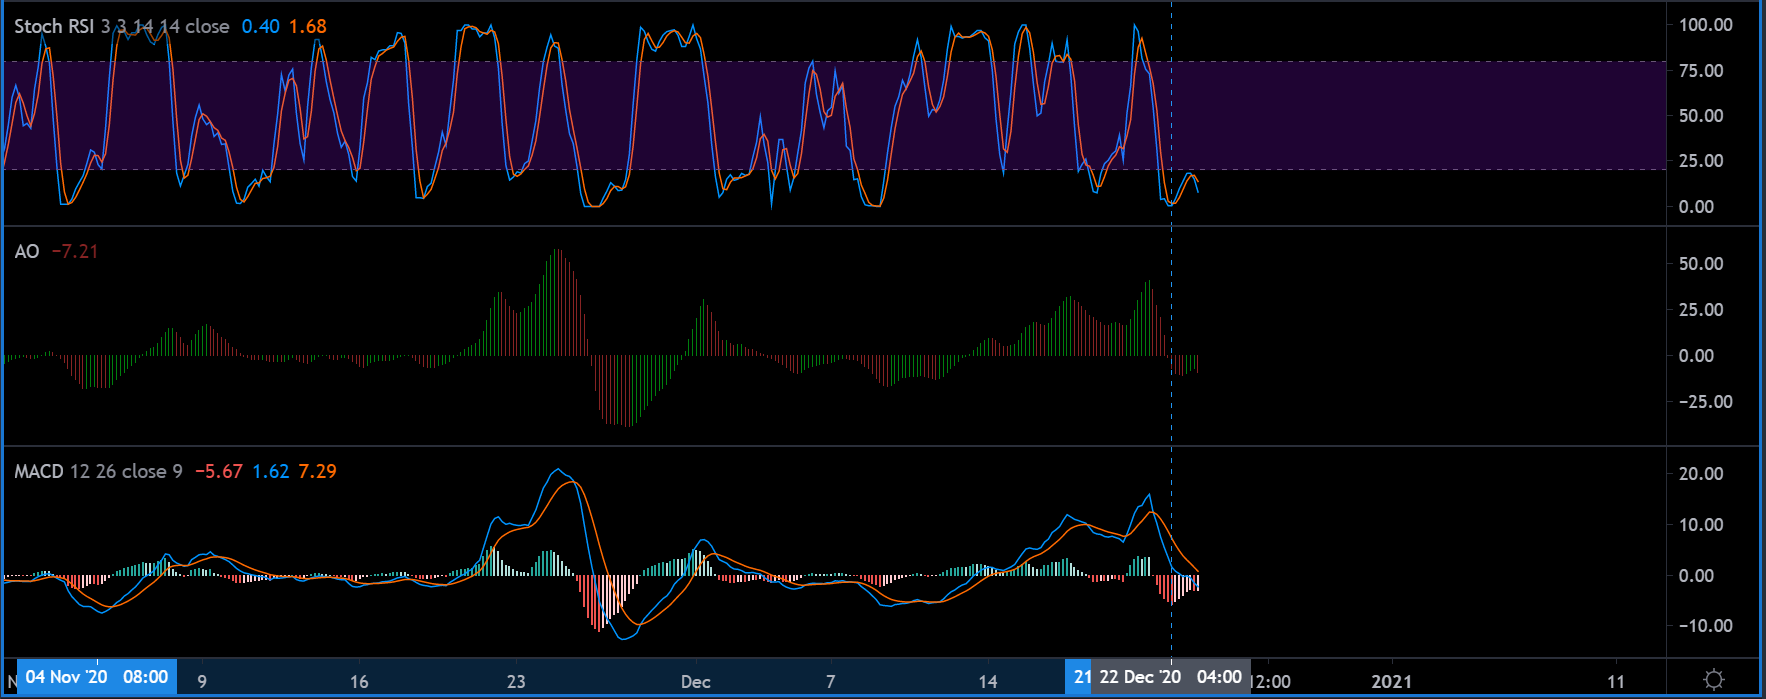
EMA Ribbons are estimating a reversal as the ribbons appeared to converge in the charts. It suggested that a shift towards a bullish period remains a possibility. Stochastic RSI suggested the same as the placement at the over-sold region is definitely a short-term event.
Awesome Oscillator or AO did not convey any bullish recovery but the bears weren’t strongly maintaining their grip either.
MACD suggested the continuation of a bearish period.
Conclusion
The price movement of Bitcoin Cash is currently extremely volatile and price swings should be expected going forward. The fact that the value continues to remain above $300 is a positive sign, but things may change quickly over the next few days.


