Bitcoin Cash, Solana, MATIC Price Analysis: 24 June

The last 24 hours have seen the cryptocurrency market at its most volatile, with the cumulative trading volume falling despite the sector’s alts trading in the green, at press time.
Bitcoin Cash was up by 5.2% while MATIC was up by 1.3%. However, Solana’s recovery was relatively slower, and it was instead down by 0.7% over the same period.
Bitcoin Cash [BCH]
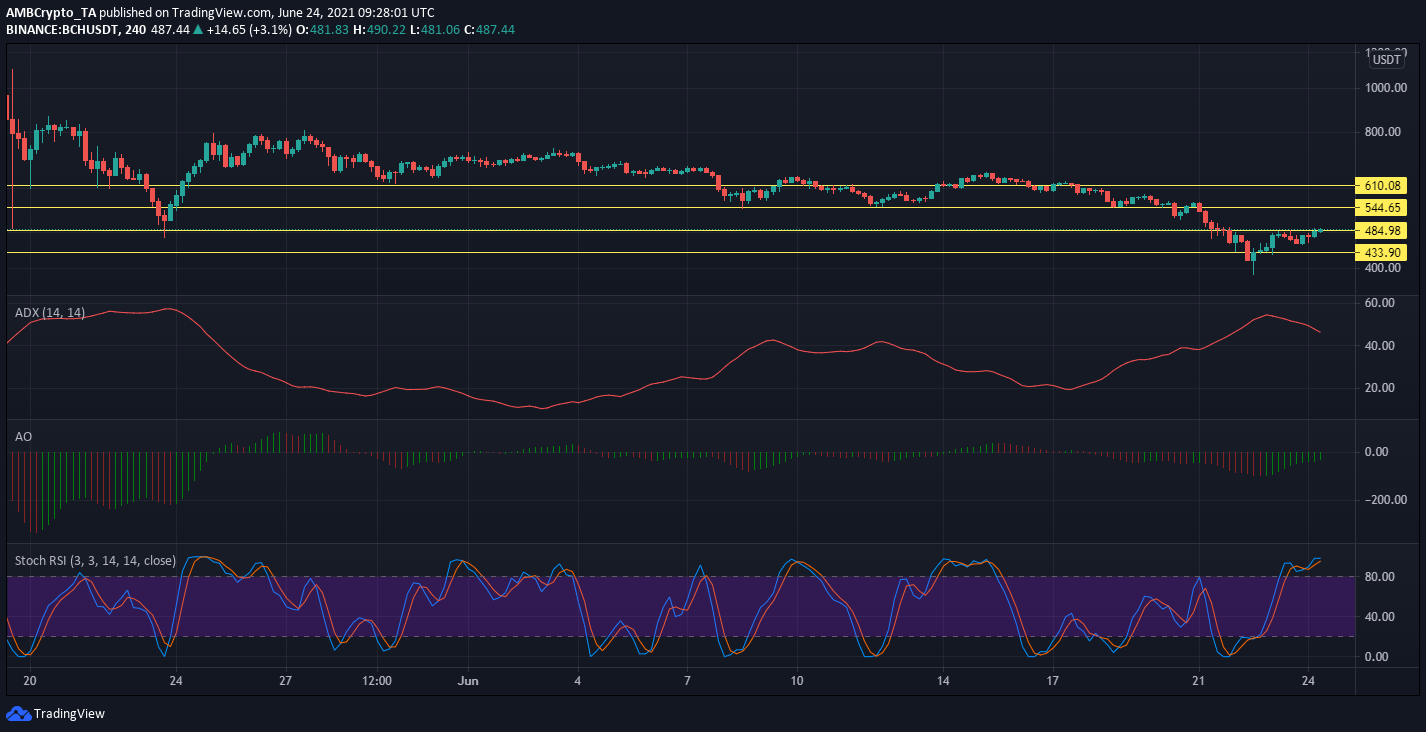
Bitcoin Cash fell by 17.5 percent on the charts in the last 7 days. The asset’s price, however, has been in recovery mode over the last 2 days, especially after it dipped to its lowest level since April. It was ranked 9th on Coingecko and had a market cap of $9 billion.
A couple of days ago, BCH was touching the lower support range at $384 – a long-term support that was last tested in April. If this support level is breached, the price may fall further. On the other hand, for BCH to continue its recent uptrend, it has to maintain its position around the $433 support range.
Further, in light of the fact that the latest candle was emerging above the $484 resistance, there were chances that it may test the next resistance range at $544.
According to the 4-hour chart, the Stochastic RSI above 80 signaled a pullback. The Average Directional Index pointed to a strong trend, one which may abate going forward. The Awesome Oscillator pictured bullish momentum creeping up.
Solana [SOL]
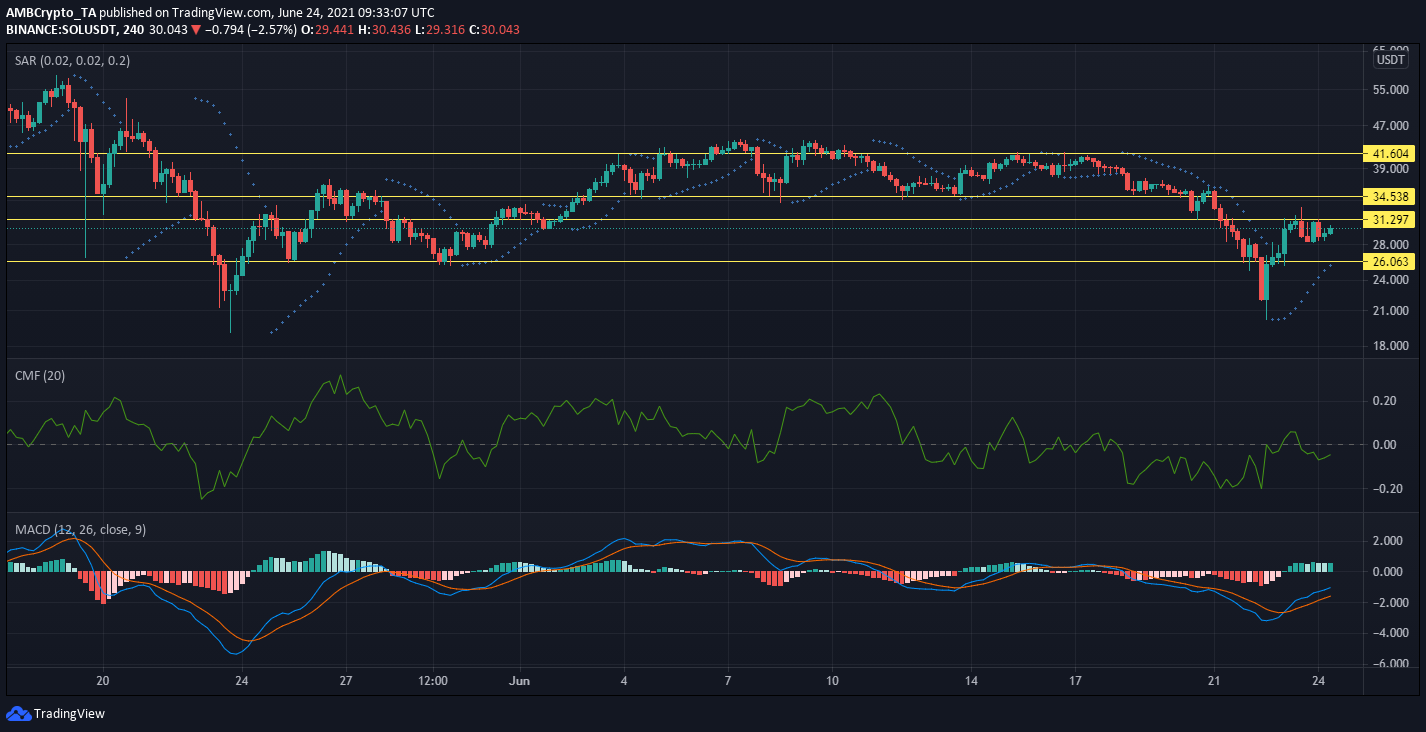
Solana was down 25.6 percent over the last seven days. Ranked 14th on Coingecko, its market cap was $7.9 billion at the time of writing.
On 22 June, SOL had dipped to $21, a support range that had been breached only once over the previous month. However, the altcoin has been out of the woods since, taking support at the higher range of $26 and steadying itself below the resistance of $31, at press time.
The Chaikin Money Flow indicator was below but close to the zero line and suggested that capital outflows were still dominant and the price might see a downtrend again. However, the same can be expected to switch, especially since the other indicators were bullish.
The MACD and Signal lines noted a bullish crossover, with the histogram picturing the same as well. Further, the Parabolic SAR’s dotted markers hovered below the candlesticks and came to the same conclusion.
That being said, there was still some uncertainty around, with the prevailing trend unlikely to be around for long thanks to the wider market’s volatility.
Polygon [MATIC]
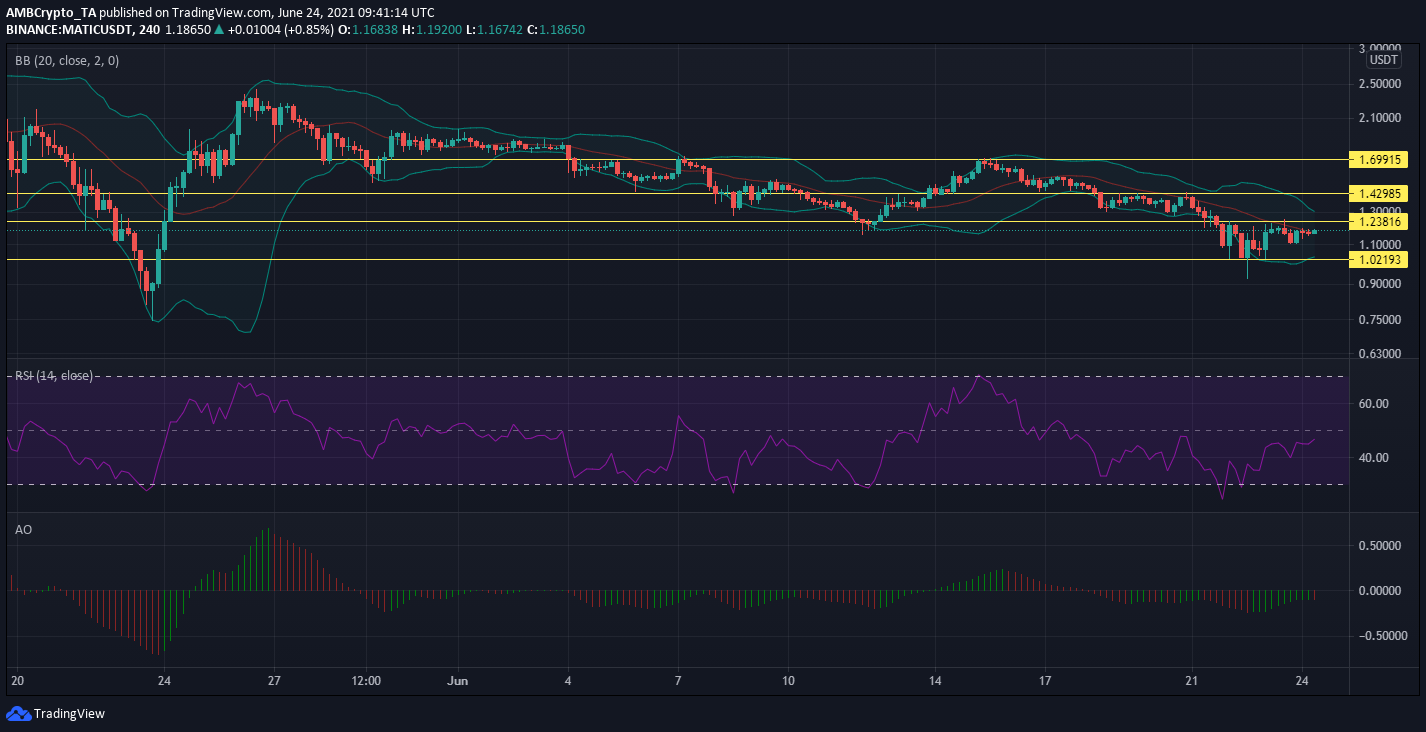
MATIC’s price has been consolidating between the $1 support and $1.2 resistance levels since 21 June. In fact, the coin made a quick recovery after breaching the support once on the 22nd.
Over the last 7 days, MATIC was down by 19.4 percent. It was ranked 16th on Coingecko and was changing hands at $1.19, at the time of writing. Its market cap was up 0.63 percent and was worth $7 billion.
The Bollinger Bands were converging and pointed to lowering volatility. The Relative Strength Index was moving up, underlining a hike in buying pressure after briefly visiting the oversold zone earlier. The Awesome Oscillator’s recent candles, however, were a mix of both bullish and bearish momentum.
The project was in the news recently after Charged Particles, a DeFi NFT on Ethereum, recently went live on Polygon.