Bitcoin Cash, Tron, Cosmos Price Analysis: 02 May

The recent market-wide crumble kept the broader sentiment within the bonds of fear for weeks now. Bitcoin Cash and Cosmos were more sensitive to these movements as they poked their multi-month lows on 1 May.
On the other hand, Tron glided over its critical resistances and turned them to support after registering double-digit 24-hour gains.
Bitcoin Cash (BCH)
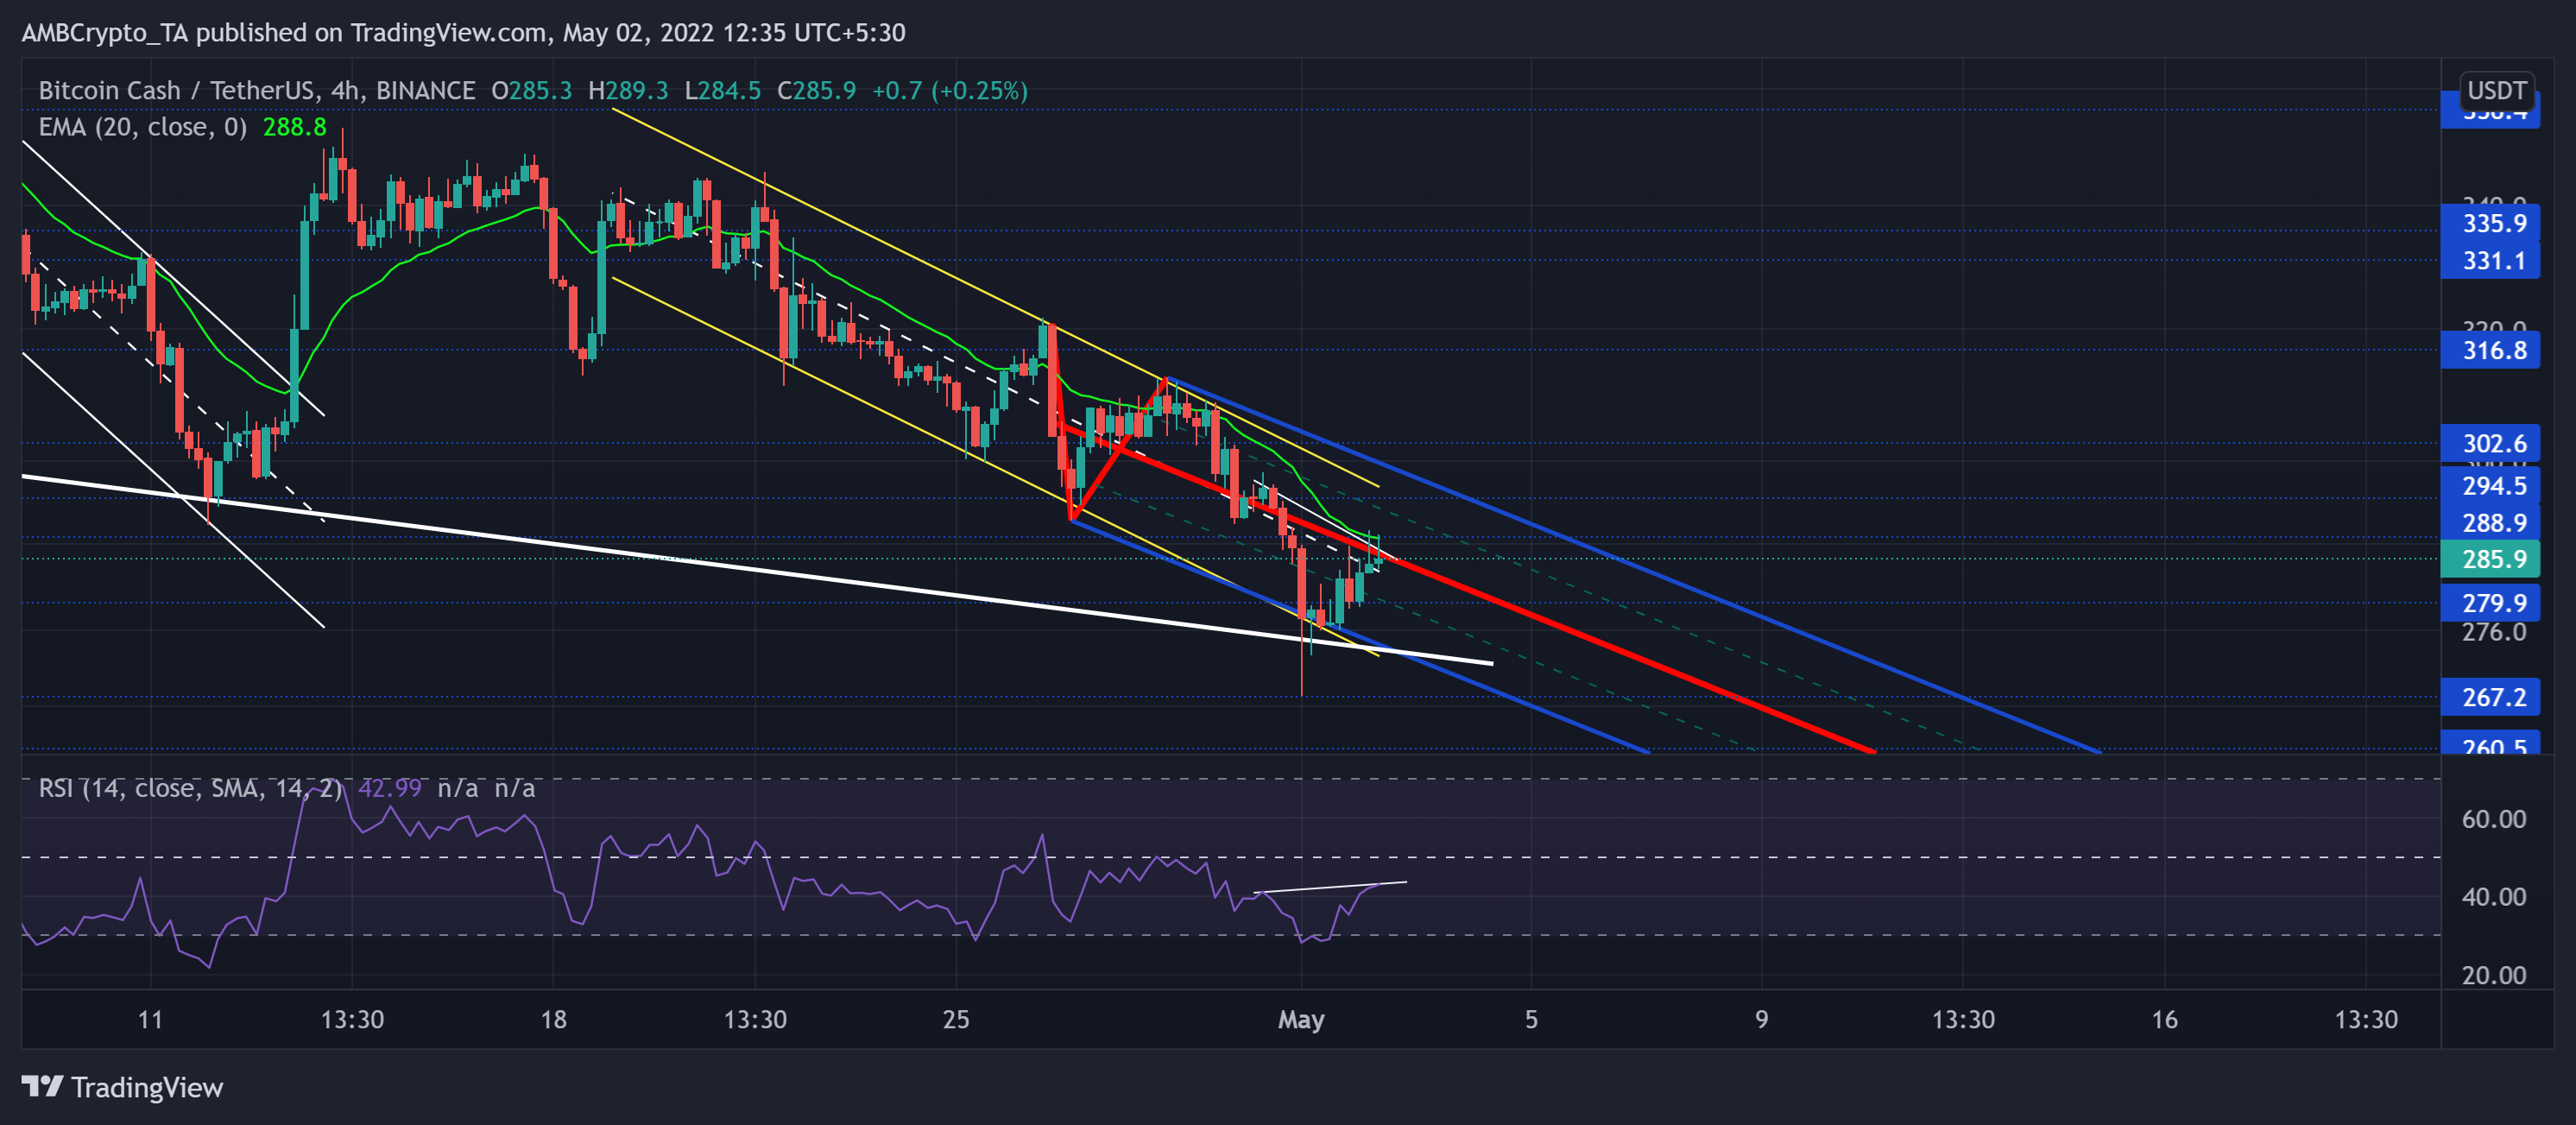
After the sellers pierced below the $387-mark in January, BCH bounced back and forth between $260 and the above mark for nearly four months. Thus, the previous bull run saw an expected u-turn from its long-term ceiling at $387.
This reversal paved way for a 31.57% drop that propelled a plunge toward its two-month low on 1 May. Despite the diminution, the buyers flipped the long-term trendline resistance to immediate support (white).
The recent rebound from the lower fence of the Pitchfork drove the alt to test its median (red) after an over 5% gain over the last day. The bulls needed a close above the 20 EMA (green) to reclaim their lost near-term edge. At press time, BCH traded at $285.9. After rising from the oversold lows, RSI’s recent movements have revealed ease in selling pressure. But its higher peaks in the last two days opened a doorway for a hidden bearish divergence.
Tron (TRX)
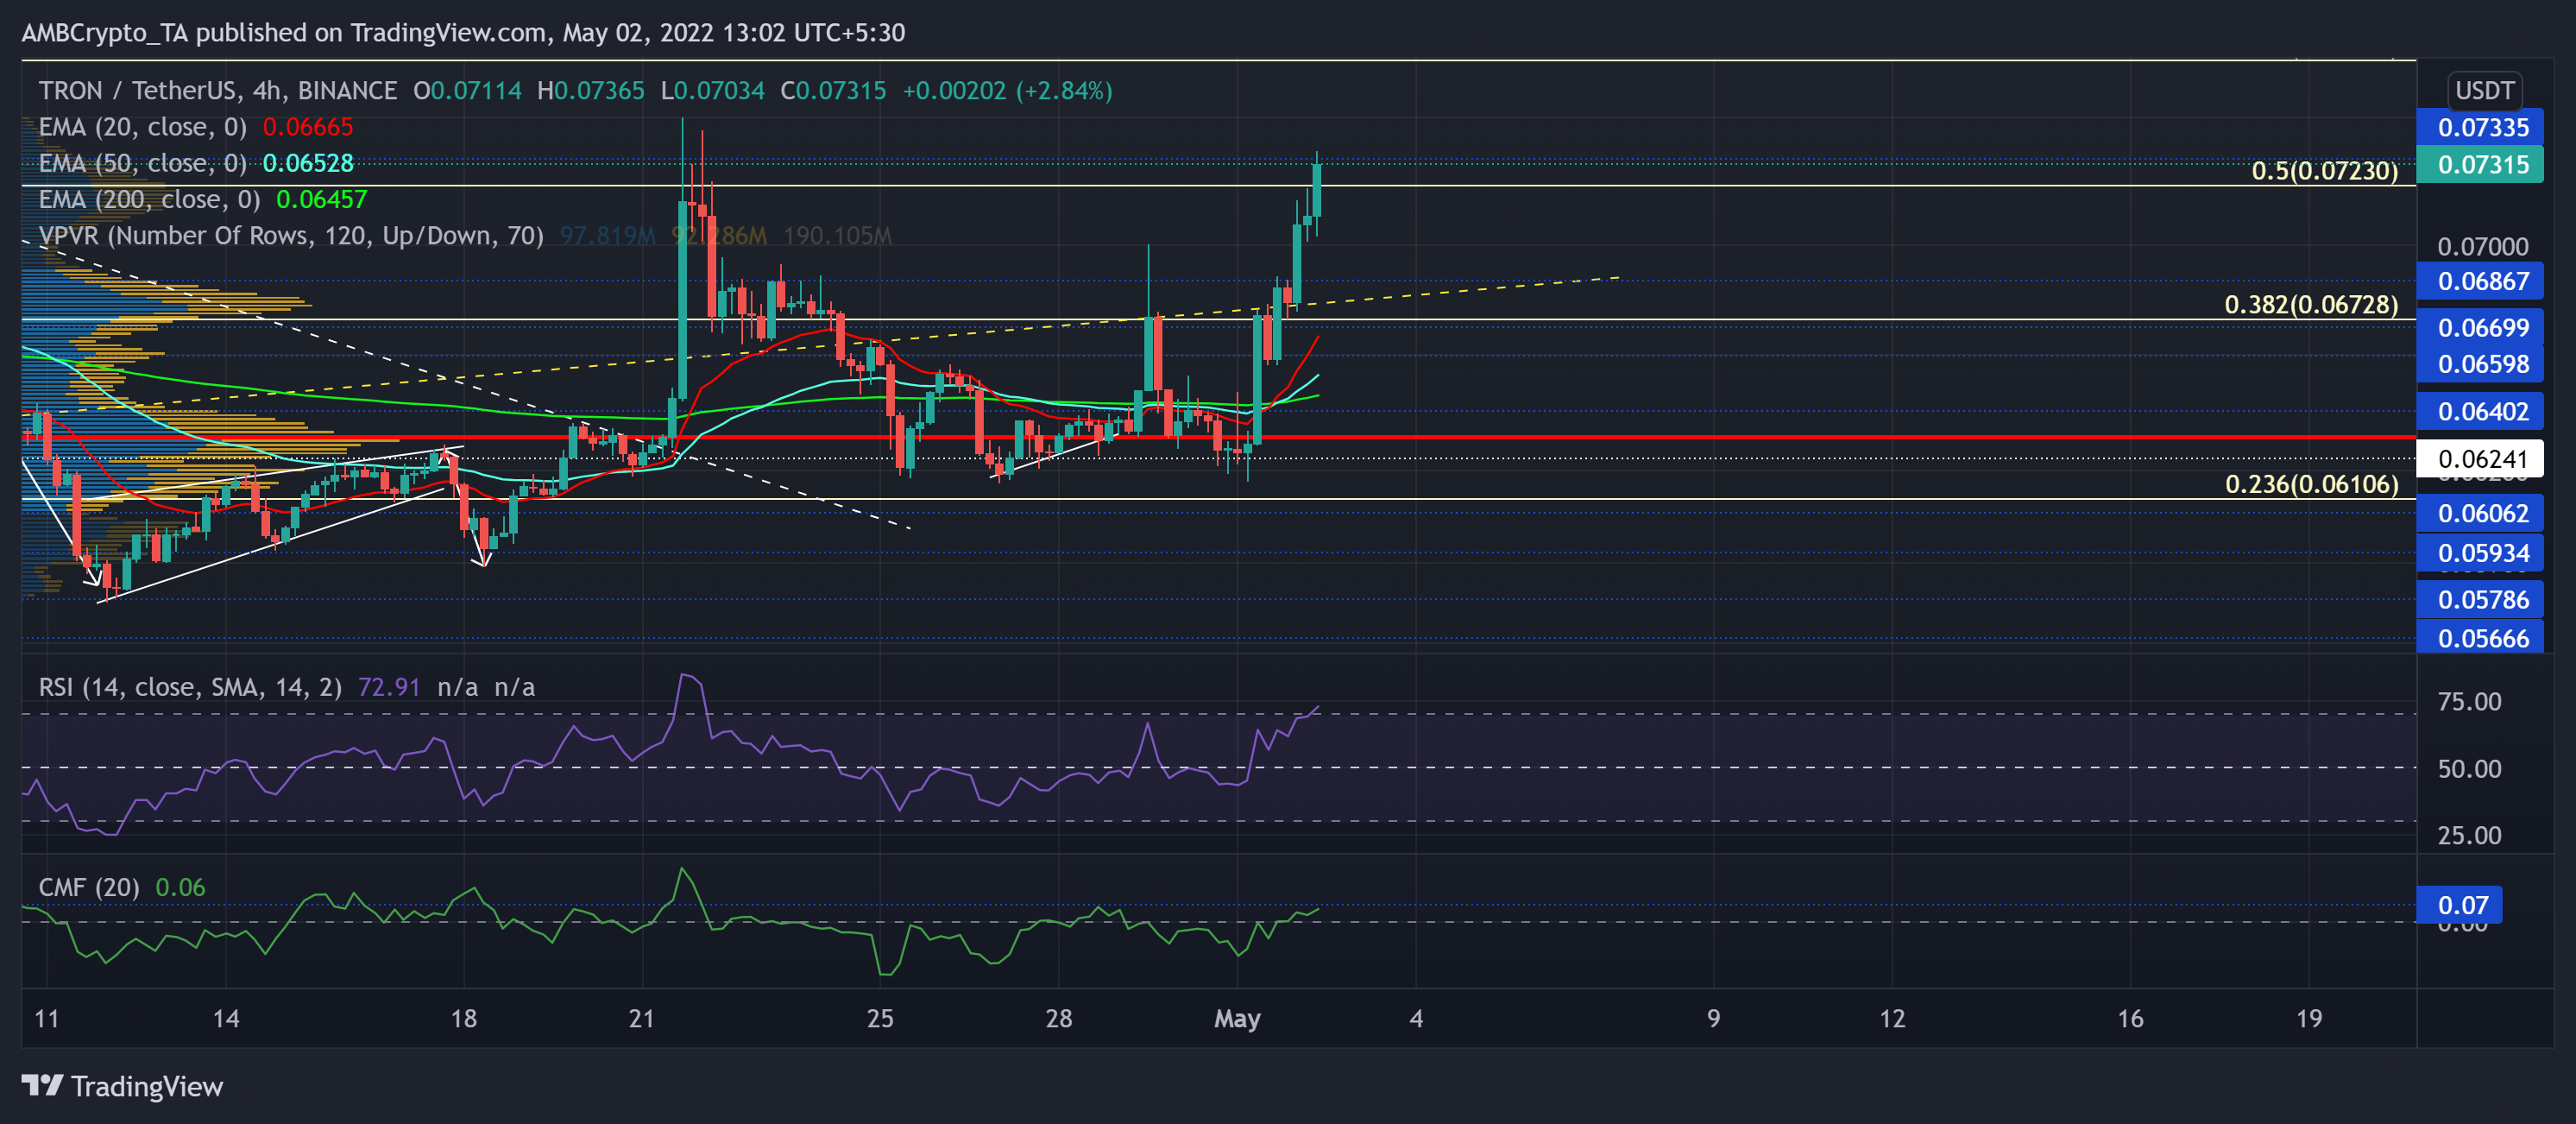
The buyers unveiled their increasing vigor by driving the price above TRX’s three-month trendline support (yellow, dashed) on 1 May. While recovering from its April lows, buyers built enough pressure to snap the Point of Control (POC, red) and eventually the 38.2%, 50% Fibonacci level.
Interestingly, the press time rally has already fetched over 18% gains over the past day. Thus, pushing TRX way above its 20/50/200 EMA while the bulls aim to challenge the $0.073-mark.
At press time, TRX was trading at $0.07315. The RSI saw rapid 24-hour growth as it approached the overbought mark. Further, the CMF corresponded with the bullish narrative by jumping above the zero-mark. Any close below its immediate resistance could lead to a sluggish phase on the charts.
Cosmos (ATOM)
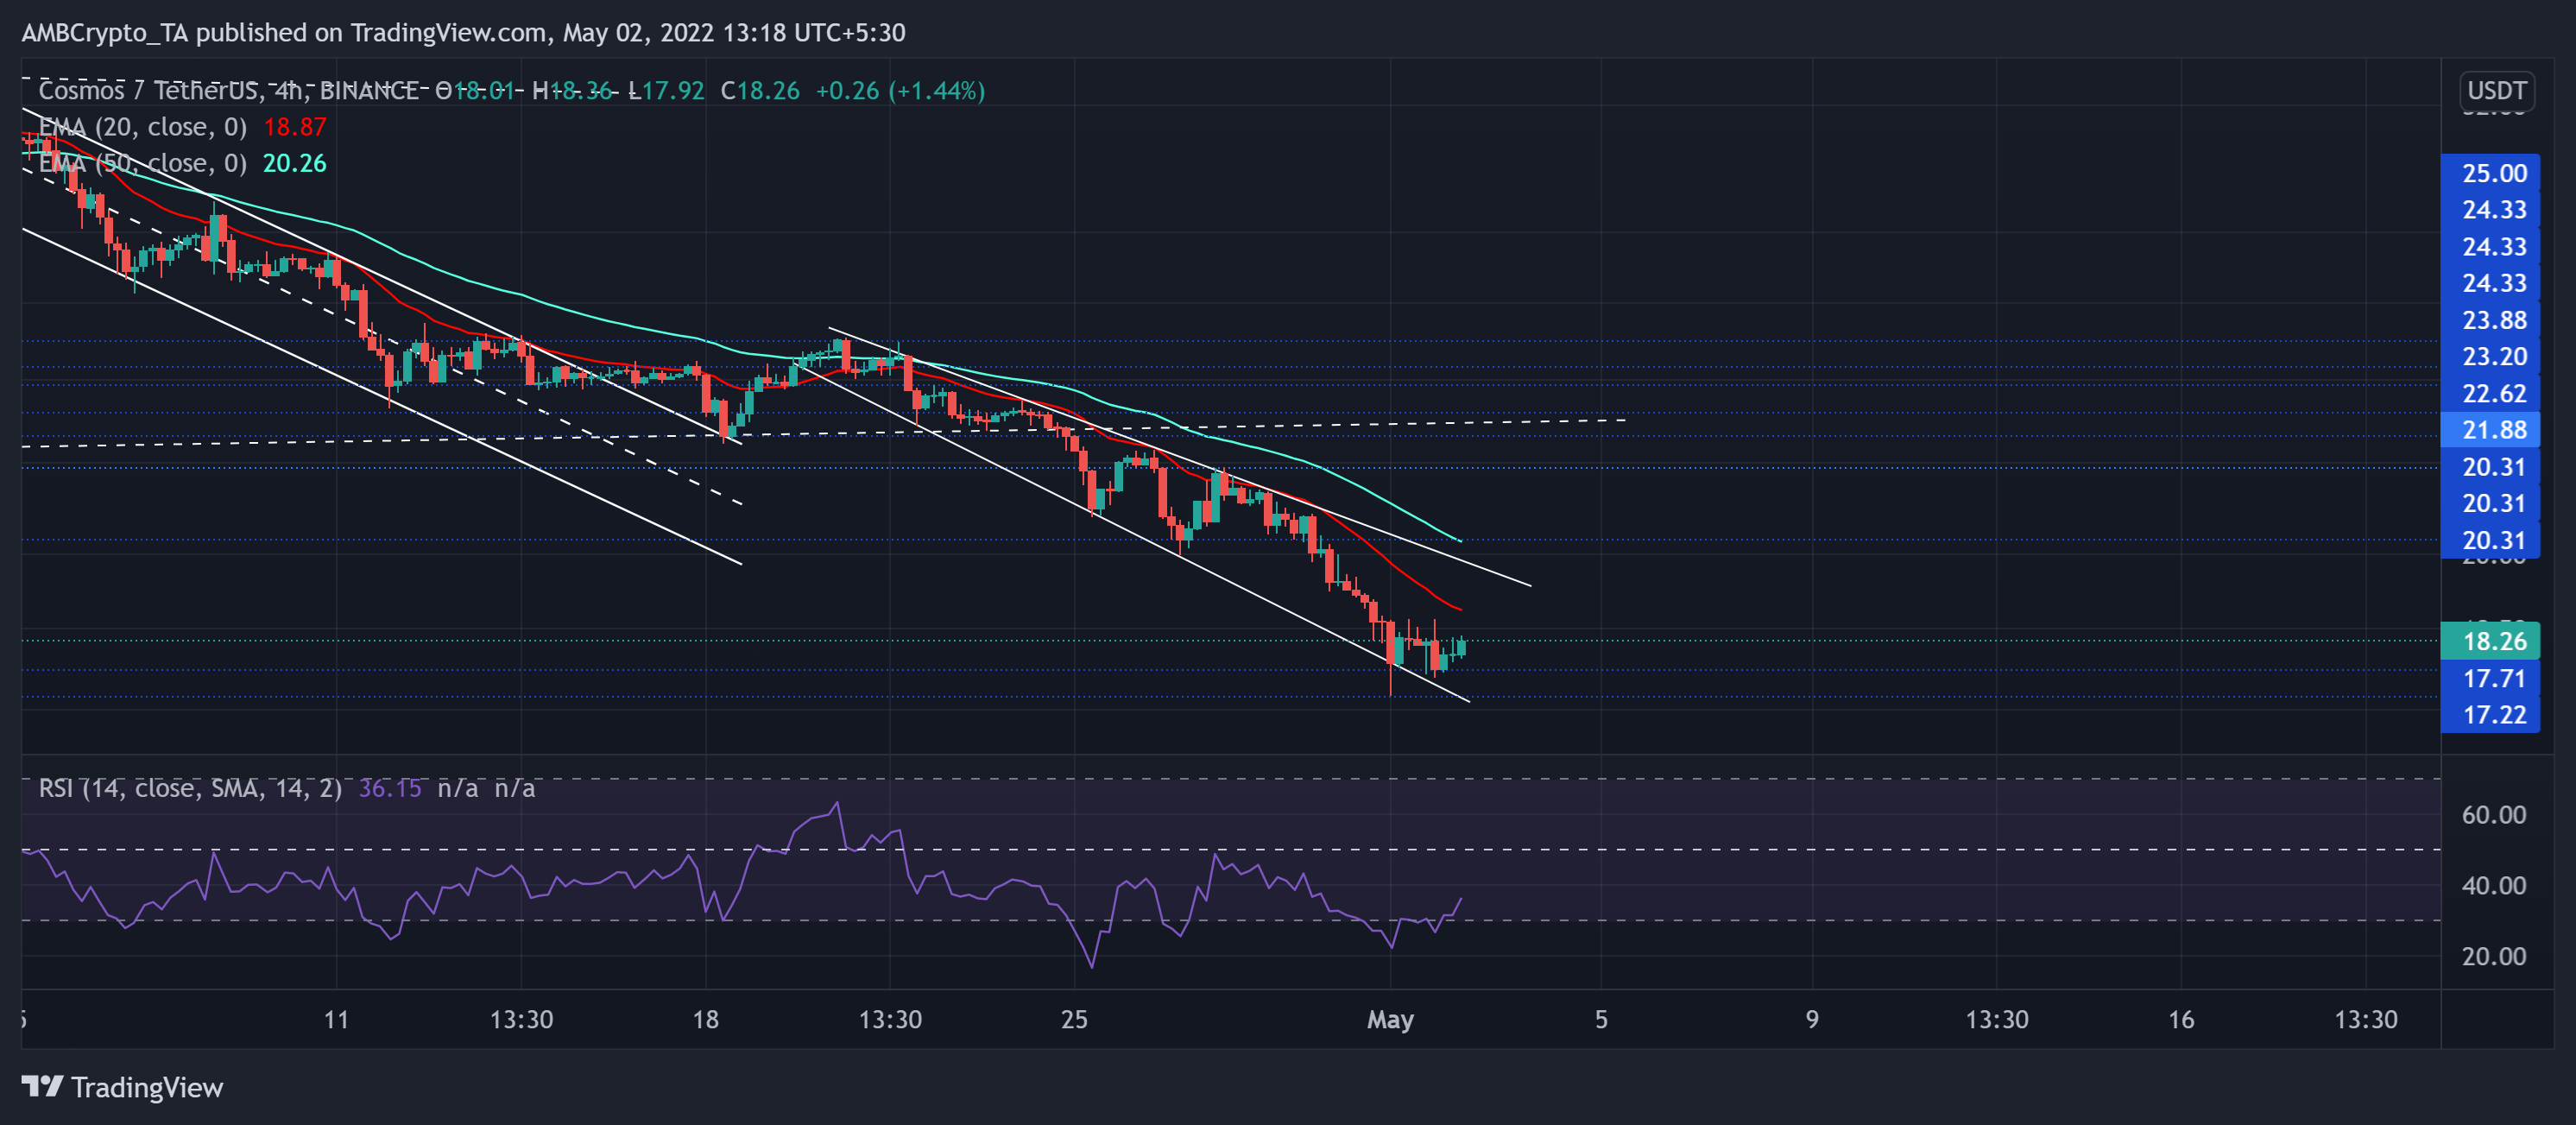
On a longer timeframe, the bulls had managed finally managed to drive higher troughs from December to April. But the recent sell-off phase led ATOM to lose nearly 31.4% (from 20 April) of its value until it touched its eight-month low on 1 May.
As the $17-base has reignited some buying power, the bulls could eye for a retest of the 20 EMA (red). At press time, ATOM was trading at $18.26. A close above the 20 EMA hurdle could position the alt for an extended recovery toward the $19-zone in the coming times.


