Bitcoin Cash, Tron, FTX Token Price Analysis: 01 February

Although the broader altcoin market saw mixed signals on the charts over the past 24 hours, BCH, TRX, and FTT flashed bullish signals at press time. BCH eyed a move above its 20-SMA, while FTT looked to break above the upper ceiling at $11.6. TRX was also projected to rise higher on the charts, but it was not certain whether the price could sustain itself above $0.03 support.
Bitcoin Cash [BCH]

Bitcoin Cash has been under some selling pressure as gains retraced by nearly 9% in the last seven days. Bearishness was noted in its market as the price slipped below its 20-SMA (yellow) and 200-SMA (green) on the 4-hour chart. On the other hand, prices did show some short-term bullishness at the time of writing as the indicators favored the buyers in the short term.
The Chaikin Money Flow sharply moved upwards, a sign that capital inflows were strong for BCH. The Awesome Oscillator also slightly favored the bulls. Despite the recent price action, a break above the 200-SMA was unlikely over the coming sessions as the coin’s momentum seemed weak in the market and trading volume also took a dip during the past 24 hours.
Tron [TRX]
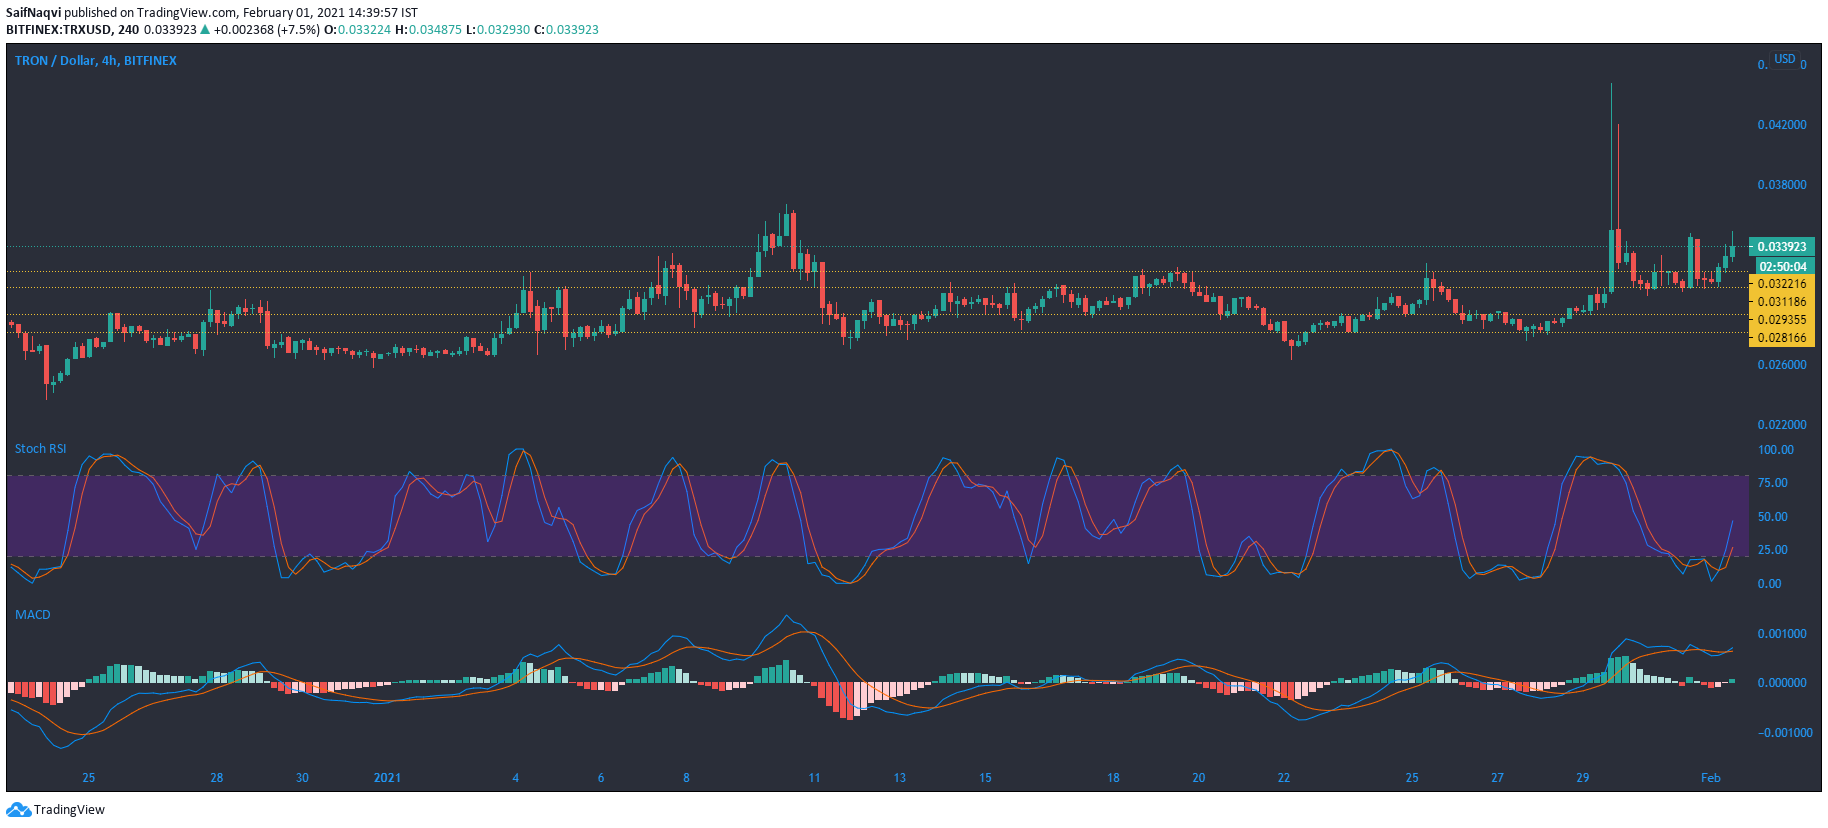
Tron witnessed some buying pressure in the past couple of sessions as the price broke above $0.03 resistance. Trading volume clocked in at over $2 billion, up by 8% since yesterday. Moreover, the Stochastic RSI pointed upwards and suggested an extended bullish scenario for TRX over the coming sessions.
However, it was unclear whether the bulls would be able to sustain the upward move on the charts, as the MACD showed a lack of strong bullish momentum. If the trading volumes also shrink over the next few sessions, TRX could drop below its immediate support.
FTX Token [FTT]
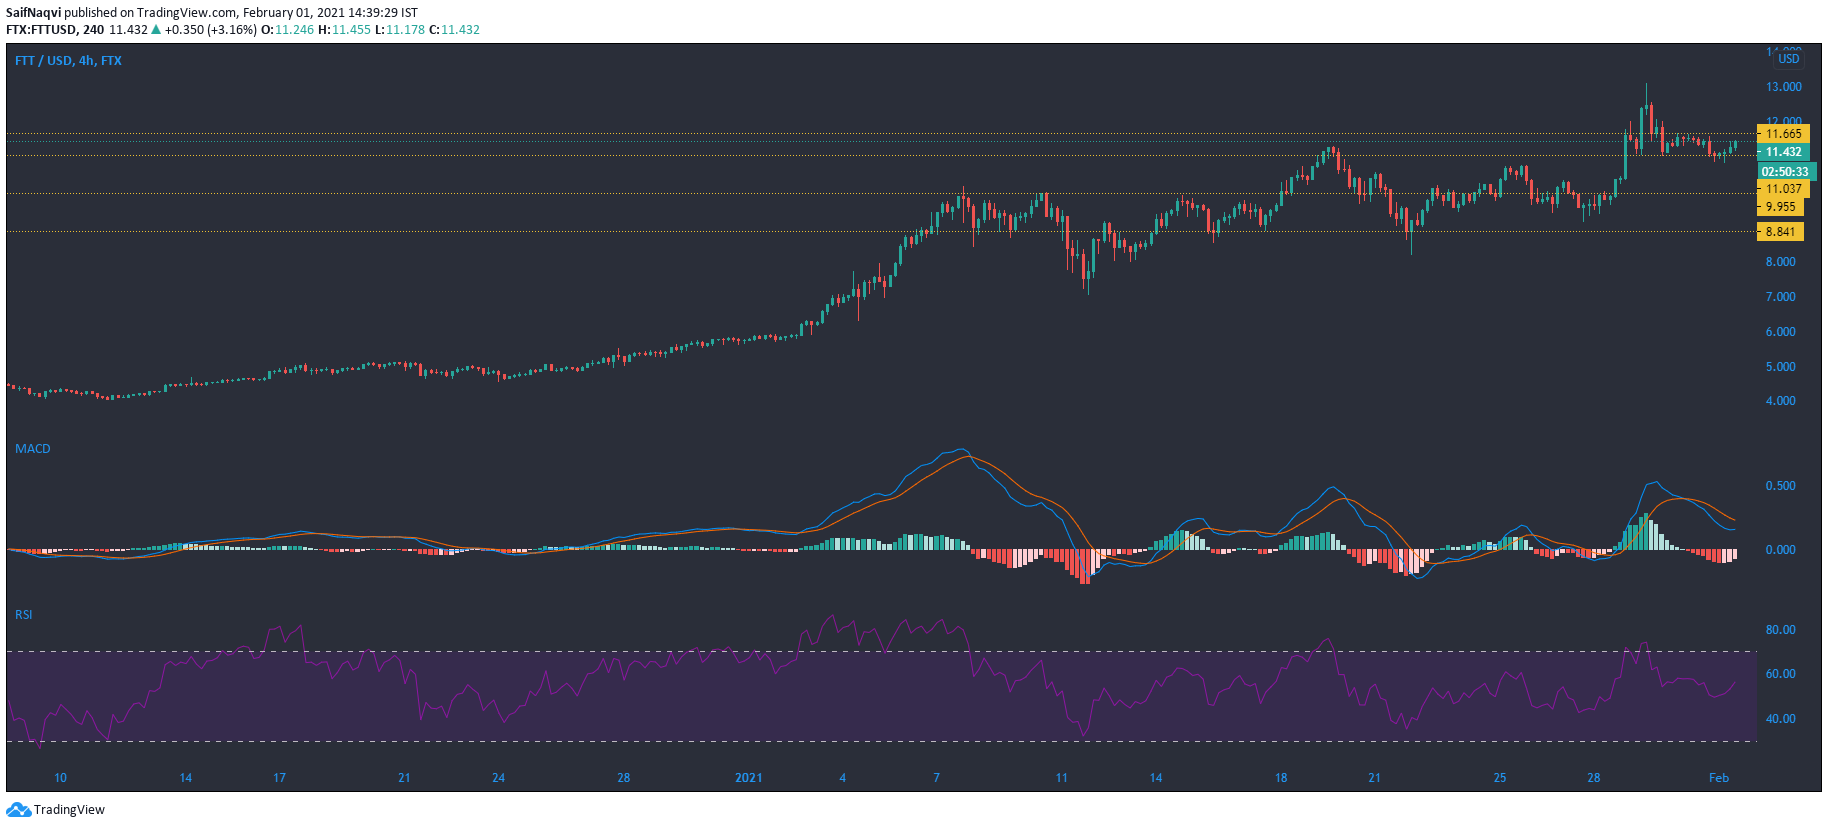
FTX Token had a favorable start to the new year as gains amounted to over 80% in the month of January. During this period, the price also scaled to multiple record highs, backed by strong buying activity. However, FTT seemed to be enduring a price correction as the coin’s trading price fell by over 9% after having hit an all-time high a couple of days back.
Support at $11 managed to trim losses as the bulls stepped in to alleviate the selling pressure. In fact, indicators favored the bulls in the short term as the Relative Strength Index pointed upwards from the neutral zone. The MACD also showed that bearish momentum was on a decline. In a bullish scenario were to unfold, FTT could rise above resistance at $11.6.


