Bitcoin Cash, Tron, MANA Price Analysis: 13 November

The crypto market gave the perception of gathering buying momentum while the bears constantly retraced the milestones achieved by the cryptos over the week.
Bitcoin Cash continued to flash bearish signs in the near term. On the contrary, MANA broke out of a descending wedge to hit the $3.8-mark and displayed withdrawal signs.
Bitcoin Cash (BCH)

The virtual currency witnessed soaring gains over six weeks by firmly scaling within the parallel channels. The ascent resulted in a 35.63% 44-day ROI. As a result, the altcoin touched its nine-week high on 10 November. After which, the bears showed resistance at the upper channel. Consequently, the retreat resulted in a 9.49% retracement over the past three days.
The bulls kept breaching the support levels while displaying sustained pressure over time. However, near-term technicals favored the sellers. At press time, BCH traded at $657.9.
The RSI was slightly below the half-line but was in an uptrend over time. Also, the MACD and AO preferred the selling strength. However, the weak directional trend and the uptrend in RSI could potentially act as catalysts for the bulls.
Tron (TRX)
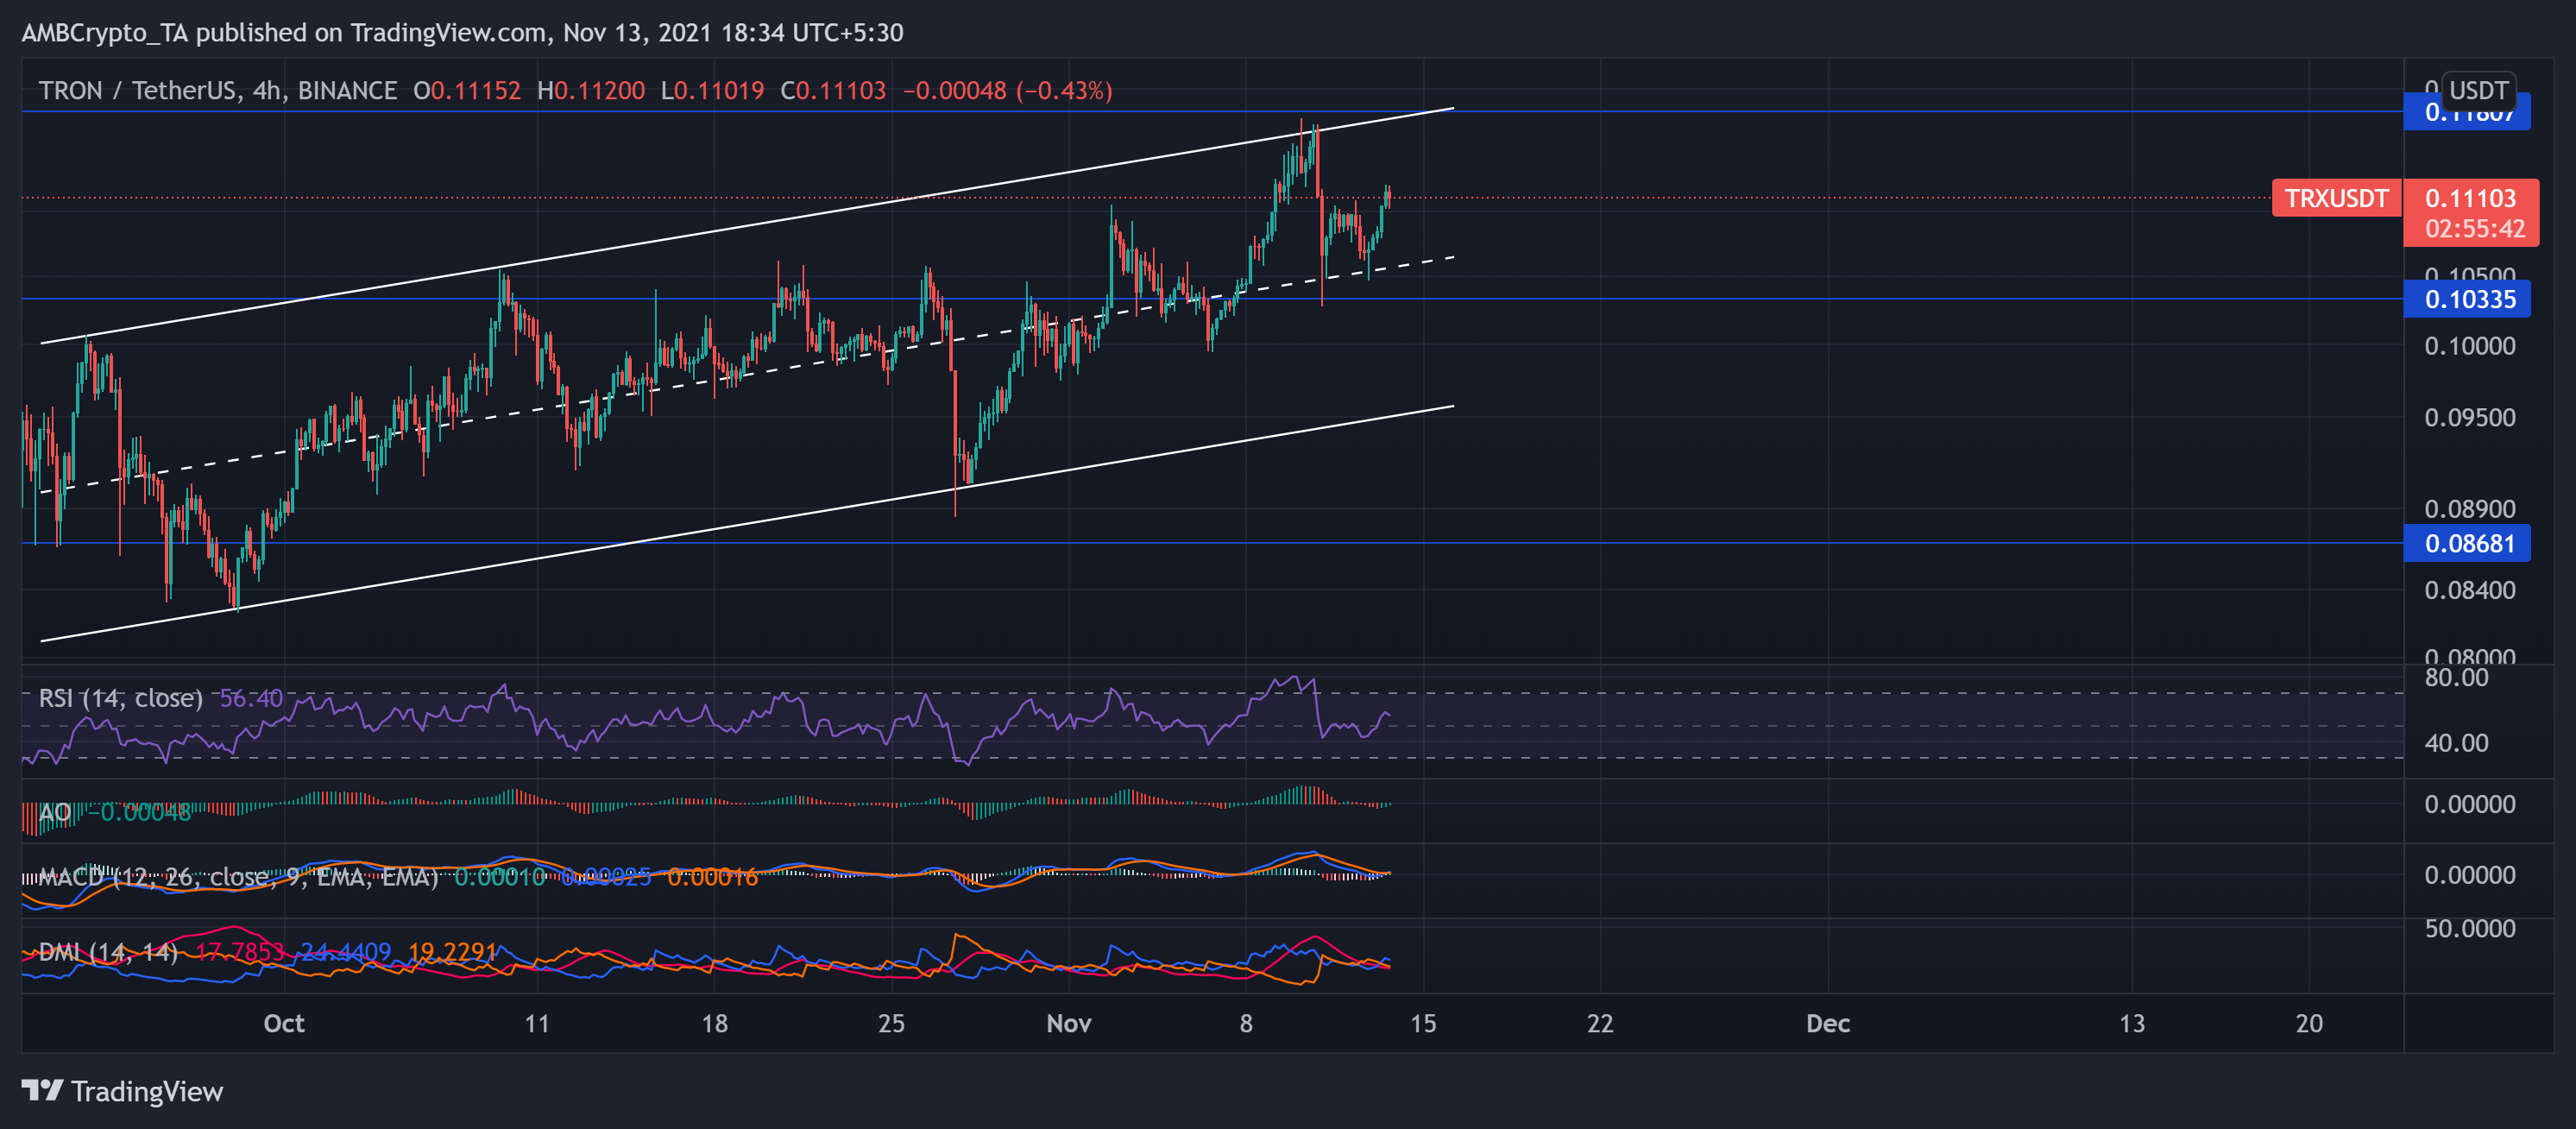
TRX observed a poised uptrend after swinging between the parallel channels heading north. It undertook the ascent over the past six weeks while recording over 35% 46-day ROI. Consequently, the rally triggered the price to its 54-day high on 10 November.
However, the bears rebutted by showing resistance at the upper channel. As a result, the price moved back into the trend after noting a 5.74% three-day decline and traded at $0.11103. Although the bears countered the bullish vigor, buyers continued to find strong support at the $1.0335-mark.
The near-term technicals showed bullish revival signs after slightly preferring the bears. The RSI surged above the midline after jumping by 12 points in 24 hours. This jump indicated the increasing buying momentum. However, the RSI seemed to point towards the midline in the near term.
Also, the MACD and AO visibly depicted a revival possibility by flashing green signs and resonated with the RSI jump. Nevertheless, the ADX continually displayed a weak directional trend.
Decentraland (MANA)
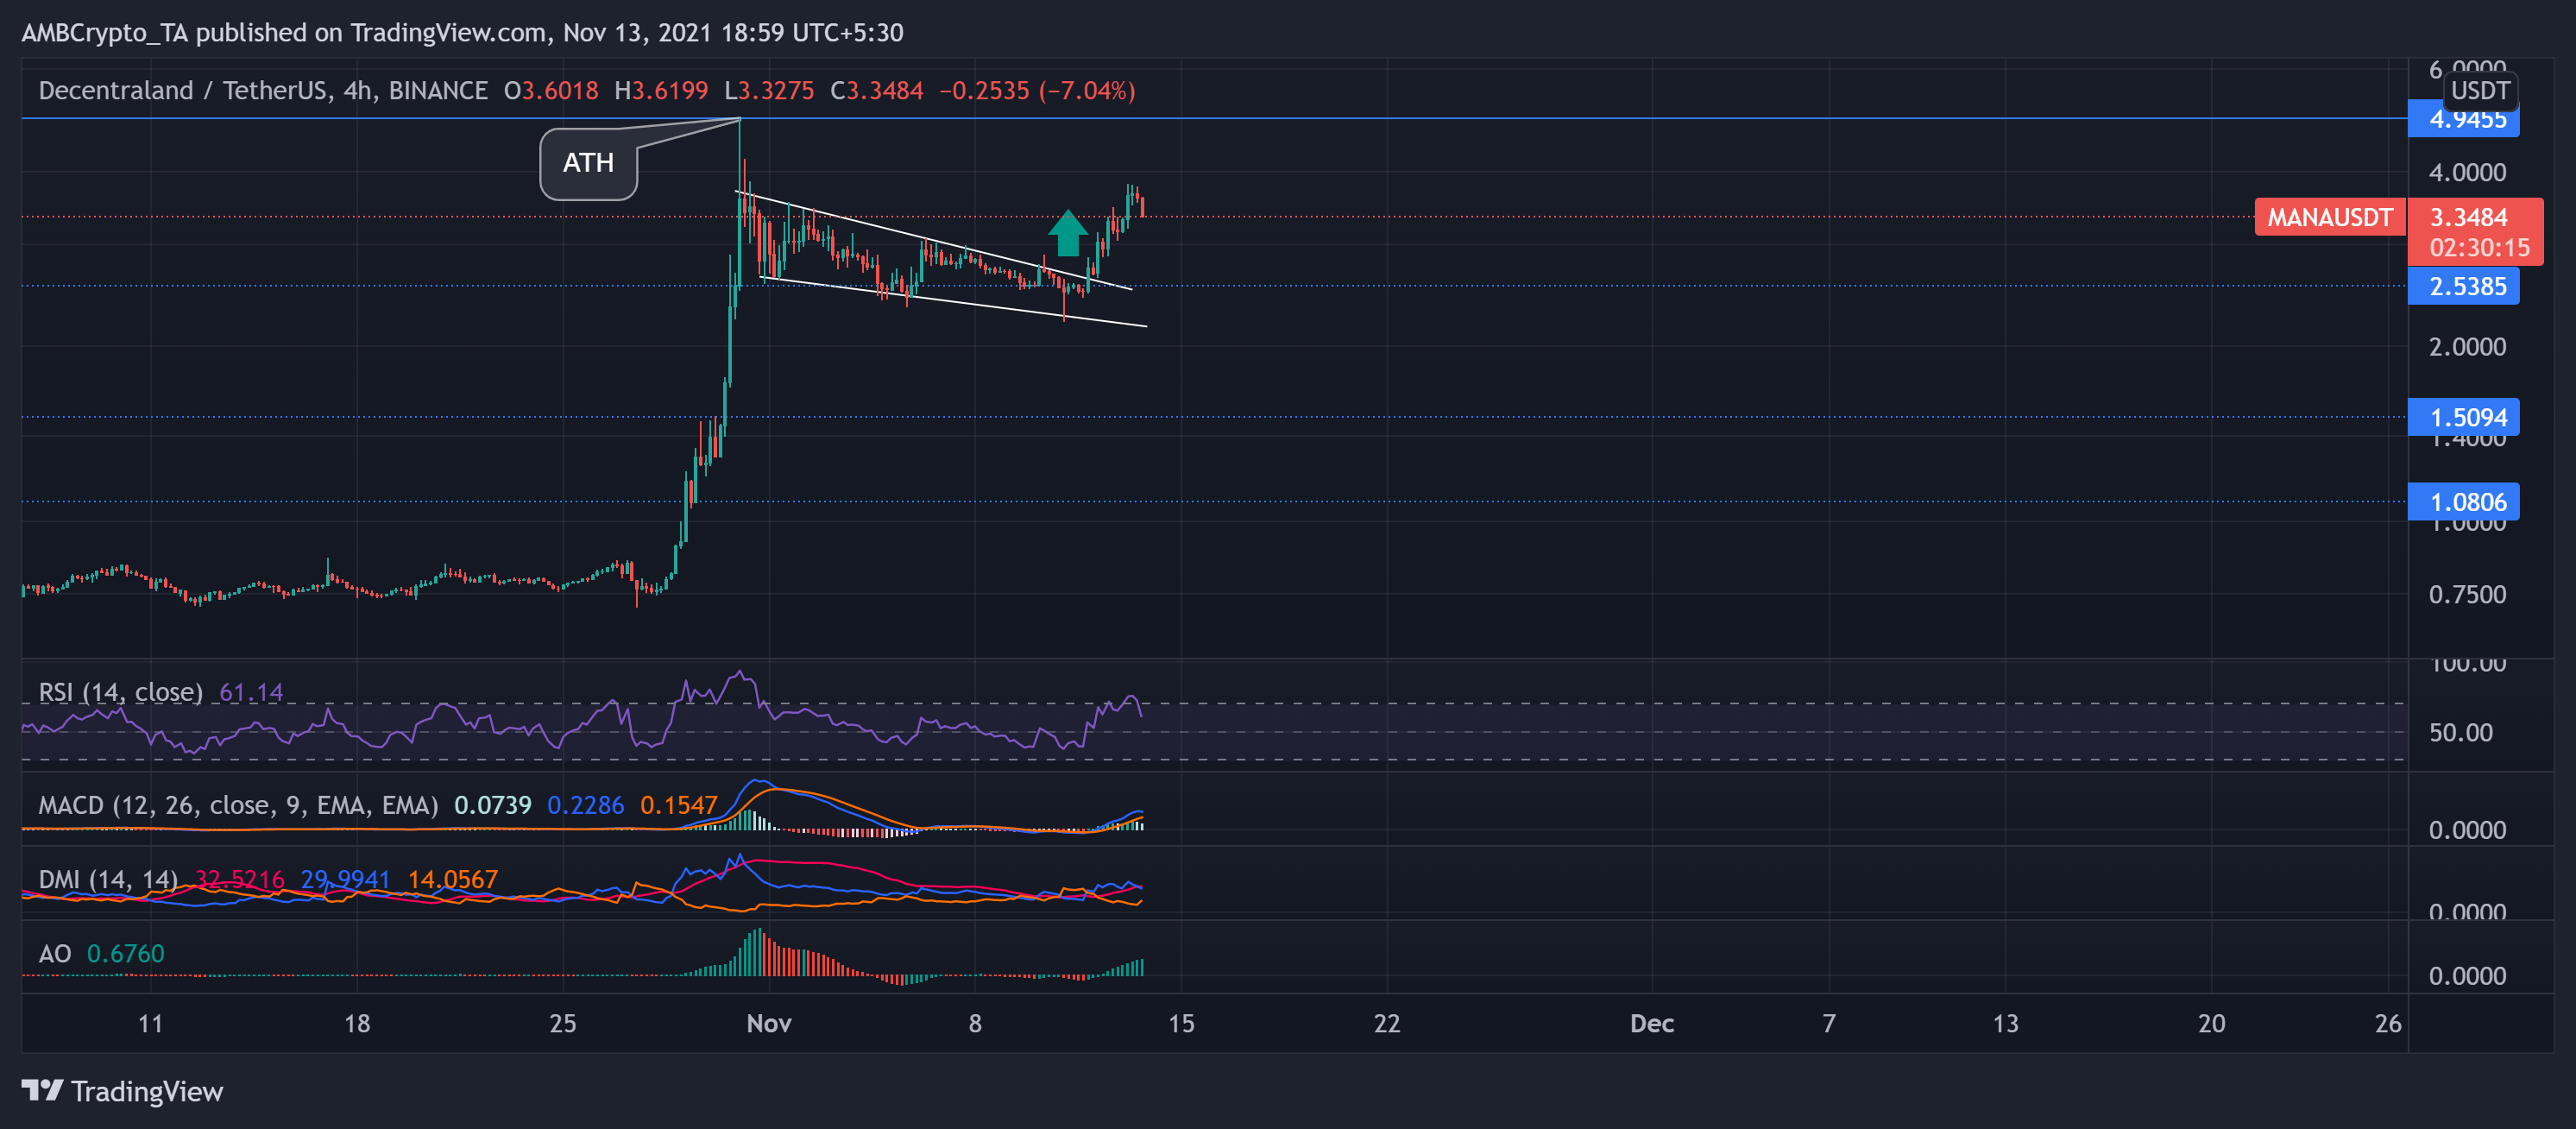
After seeing soaring gains and, resultantly, touching its ATH on 28 October, the price action saw a pullback. The withdrawal resulted in nearly 30% retracement until the bulls took over on 11 November. This bullish revival caused a descending wedge breakout as the price hits the $3.8-mark on 13 November.
The near-term technicals preferred the bulls while pointing at decreasing buying power. At press time, MANA traded at $3.3484.
The RSI was southbound after dipping from the overbought region. Also, the MACD favored the buyers but flashed shorter light green bars and corresponded with the RSI dip. Further, the DMI lines agreed with the previous analysis with a strong directional trend.
Nevertheless, the AO continued to show a preference for the buyers.


