
Bitcoin has kept everyone on their toes by exhibiting the most volatile movement this year. Rallies to $60k and crashes dropping BTC down to $29k certainly don’t induce the kind of adrenaline people are looking for. But all of this is in the past, the question that now arises is what the future holds for Bitcoin as well as the investors. Is the king coin headed towards another rally? Or is it about to fall deep into the abyss of losses?
Bitcoin Might Rally
Popular analyst Rekt Capital, in a recent analysis, brought the newly forming Wyckoff accumulation structure to attention. Wyckoff accumulation usually occurs in 4 phases. On the 8-hour scale, Bitcoin’s price action has validated phases A & B. As the king coin seems to enter Phase C, signs of the spring have been appearing as the coin briefly fell below $30k. This drop resulted in BTC reaching $28k before bouncing back to the $31k range. The next day on June 23, Bitcoin rallied and reached above $33k.
Now according to the Wyckoff accumulation schematic, the coin needs to test this $33k level as support in order to bounce ahead towards the next higher lows. Should this movement occur, not only phase C but also phase D would be validated and the coin could rally up to $40K.
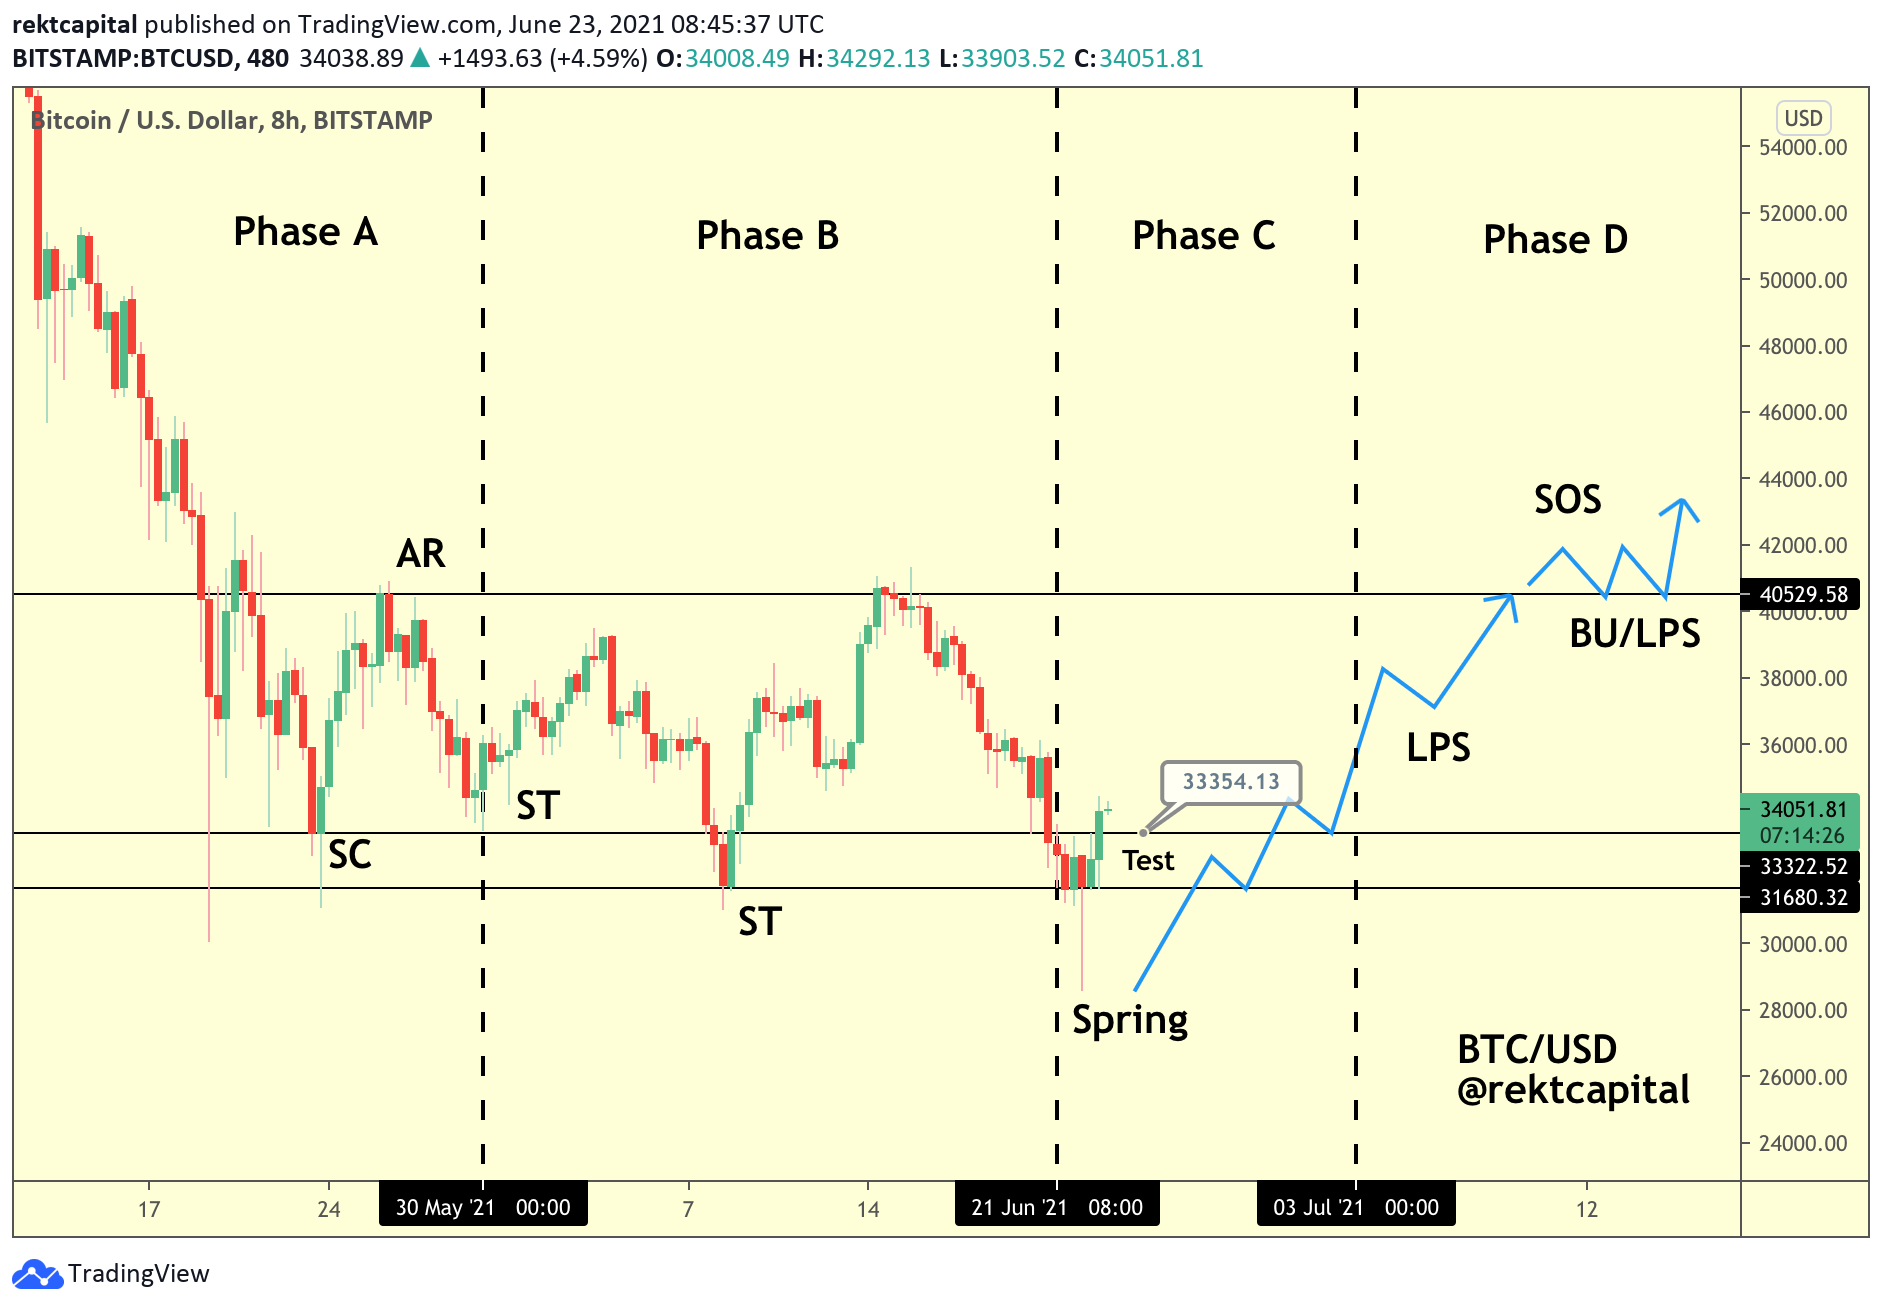
Bitcoin in micro Wyckoff accumulation (8-hour chart) | Source: Rekt Capital
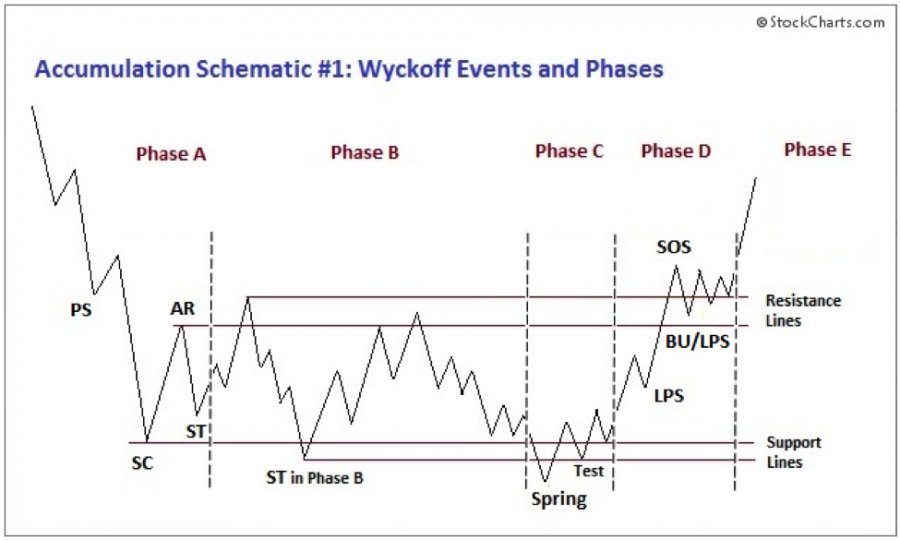
Typical Wyckoff accumulation structure | Source: Rekt Capital
Bitcoin Might Not Rally
This is also a possibility as when the king coin’s price movement is observed on the 1-day chart, the scenario is a little different. According to Rekt Capital, the larger time frame displays a Wyckoff distribution pattern.
Due to the week-long crash that occurred between May 12-19, BTC established the lower low wedging structure that fits the Wyckoff distribution schematic. Observing the chart (ref. 1 Day distribution image) shows that the coin was currently consolidating in the downtrend wedging structure. A fake breakout took place on June 14, but the coin came back down in it. If this pattern is confirmed, Bitcoin could enter phase E of the schematic could mean a continued downfall.
However, because the coin failed to establish old support as new resistance – $43k-45k range – Wyckoff distribution pattern is not confirmed. But unless the coin miraculously rallies above $40k, the coin could still enter phase E.
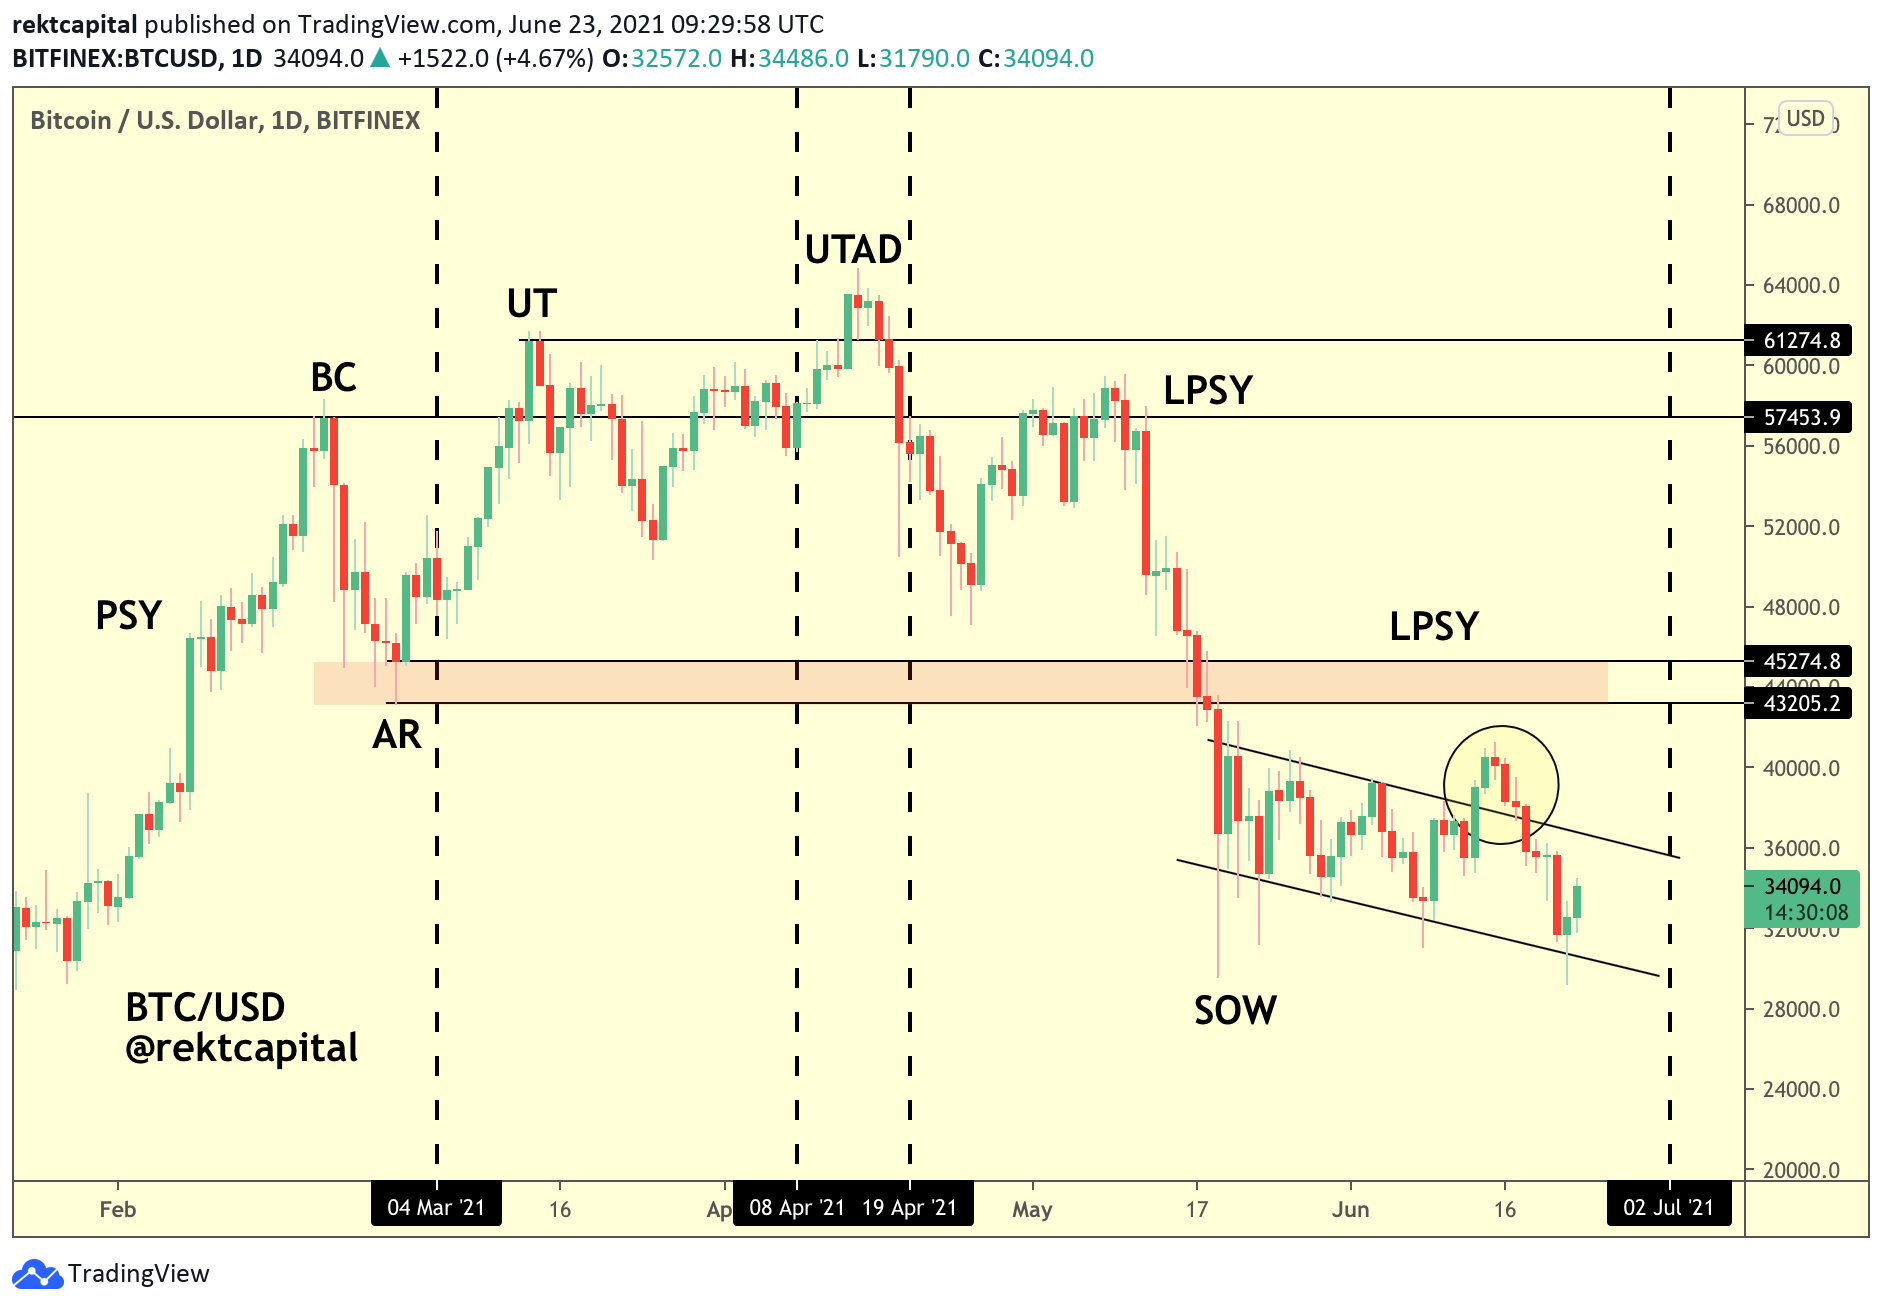
Bitcoin in macro Wyckoff distribution (1-Day chart) | Source: Rekt Capital
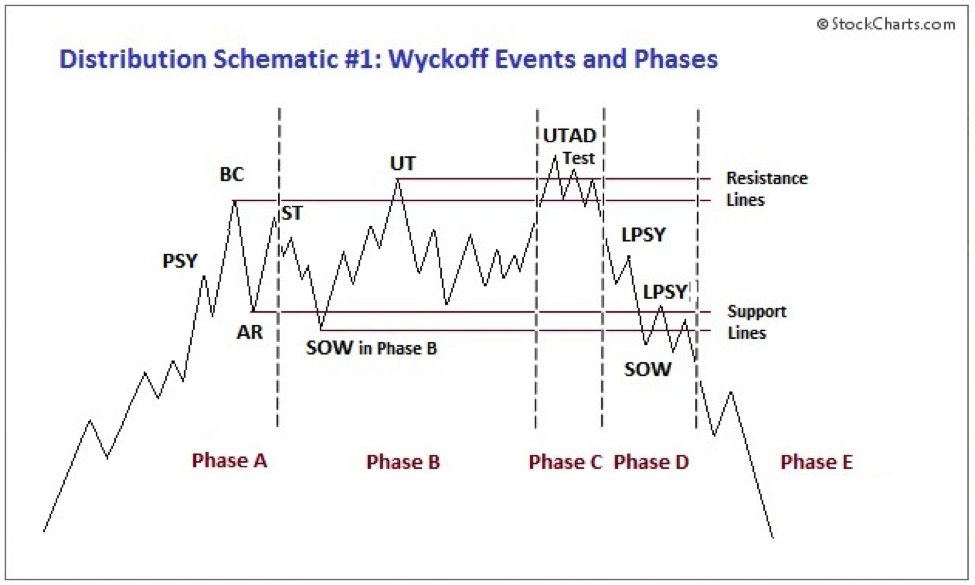
Typical Wyckoff distribution structure | Source: Rekt Capital
Both patterns are yet to be confirmed, yet their different movement is profitable for different types of investors. Wyckoff accumulation could be achieved on the 8-hour scale, thus short-term investors / short-term holders can benefit from this pattern.
Whereas, Wyckoff distribution might occur on the 1-Day scale, which would be far more beneficial for long-term investors or HODLers. In any case, Bitcoin’s exact movement can’t be explicitly predicted owing to the high volatility.