Bitcoin

Bitcoin encounters bulls in short-term but continues to reside in the bearish territory over long-term
Posted:
| Last updated: October 7th, 2019

The largest cryptocurrency by market cap, Bitcoin has witnessed a massive plummet in its price as the recent crash in the crypto market caused its price to fall to four-digits. At the time of writing, the king coin was valued at $7,966.22 with a market cap of $143.22 billion. Bitcoin recorded a 1.81% fall in its price over the past 24-hours while the volume of the coin was at $13.74 billion. Most of the trading volume came from the BKEX exchange via trading pair BTC/USDT.
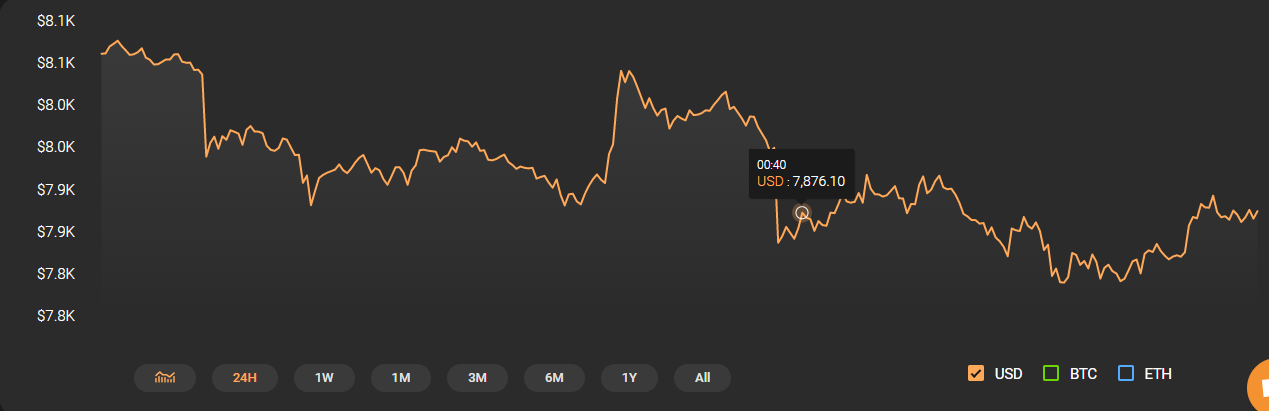
Source – CoinStats
1-Hour Price Chart
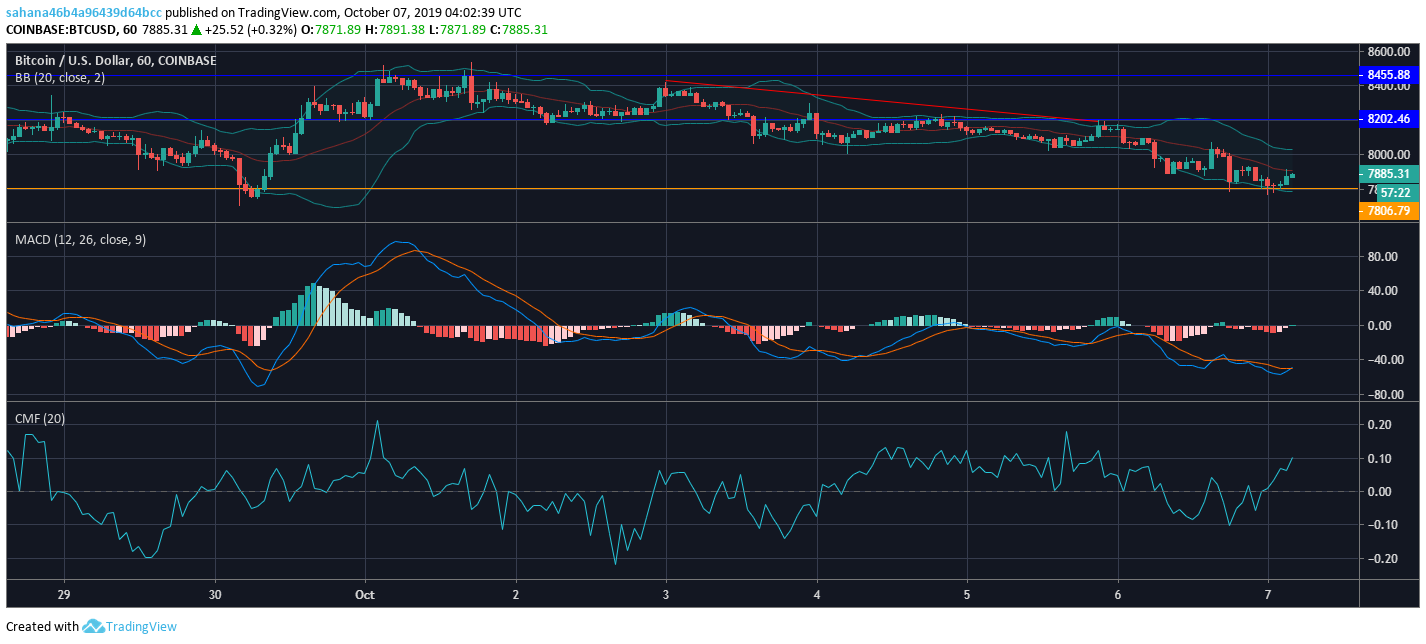
Source – Trading View
The one hour price chart of Bitcoin revealed the formation of a downtrend from $8,435.43 which extended to $8,186.86. The king coin witnessed support at $7,806.79 and resistance was seen at $8,455.88 and $8,202.46.
The Bollinger Bands indicated reduced market volatility as they were seen converging.
The MACD indicator was pointing out a bearish crossover as the signal line was above the MACD line for a very long time. However, the MACD line seems to be slowly climbing above the signal line further hinting the presence of the bulls in the BTC market.
The Chaikin Money Flow indicated that the capital flowing into the market was higher than the capital flowing out.
1-Day Price Chart
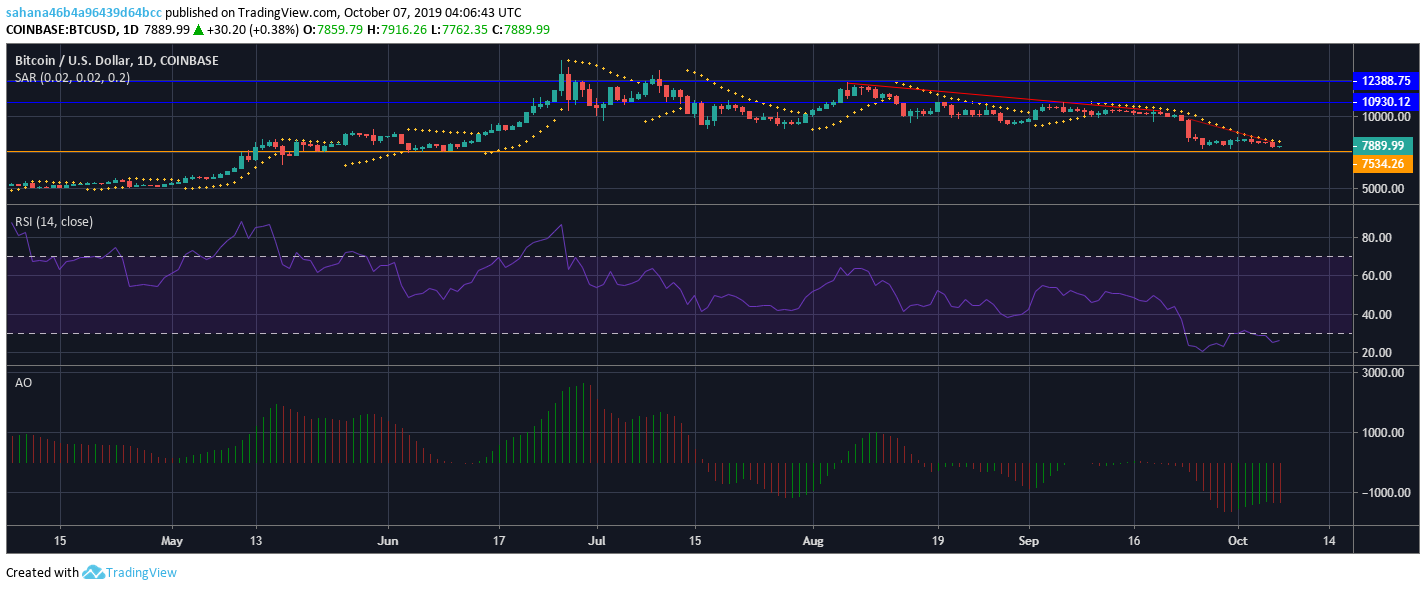
Source – Trading View
The one day chart for Bitcoin formed support at $7,534.26, while resistance was witnessed at $12,388.75 and $10,930.12. The chart also revealed two downtrends, the first one was formed from $12,297.58 to $10,383.14. The other downtrend started from $9,767.78 and extended to $8,195.20.
The Parabolic SAR indicator showed that the marker was above the candles which further implied a bearish market.
The Relative Strength Index indicator revealed that the king coin was in the oversold zone.
Awesome Oscillator exhibited the occurrence of red bars projecting a bearish presence.
Conclusion
The short term chart for Bitcoin was hinting the presence of bulls in the market, while the one day chart was seen siding the bears.