Bitcoin: Evaluating if investors are seeing a bear market rally

Bitcoin, the largest cryptocurrency has rallied strongly off the bottom, reaching above the $23k mark. So does this imply the beginning of the bull market?
Well, Glassnode in its latest weekly ‘On Chain’ report on 1 August shed some insight on this narrative. The report assessed if the current market momentum was a vote to the bear market rally.
Not-much to celebrate
Bitcoin would need to do more to escape the looming bear trap as per the report.
BTC’s number of active addresses remained within a well-defined downtrend channel in the graph below.
Notably, the October-November all-time high (ATH) reached a significantly lower peak than the April 2021 ATH. Ergo, suggesting a major washout of users had occurred, and demand didn’t quite follow through. In this regard, the report asserted,
“With exception of a few activity spikes higher during major capitulation events, the current network activity suggests that there remains little influx of new demand as yet.”
Glassnode in the graph noted this as a “low bear market demand profile” which has been in effect essentially since last December.
Let me assist you
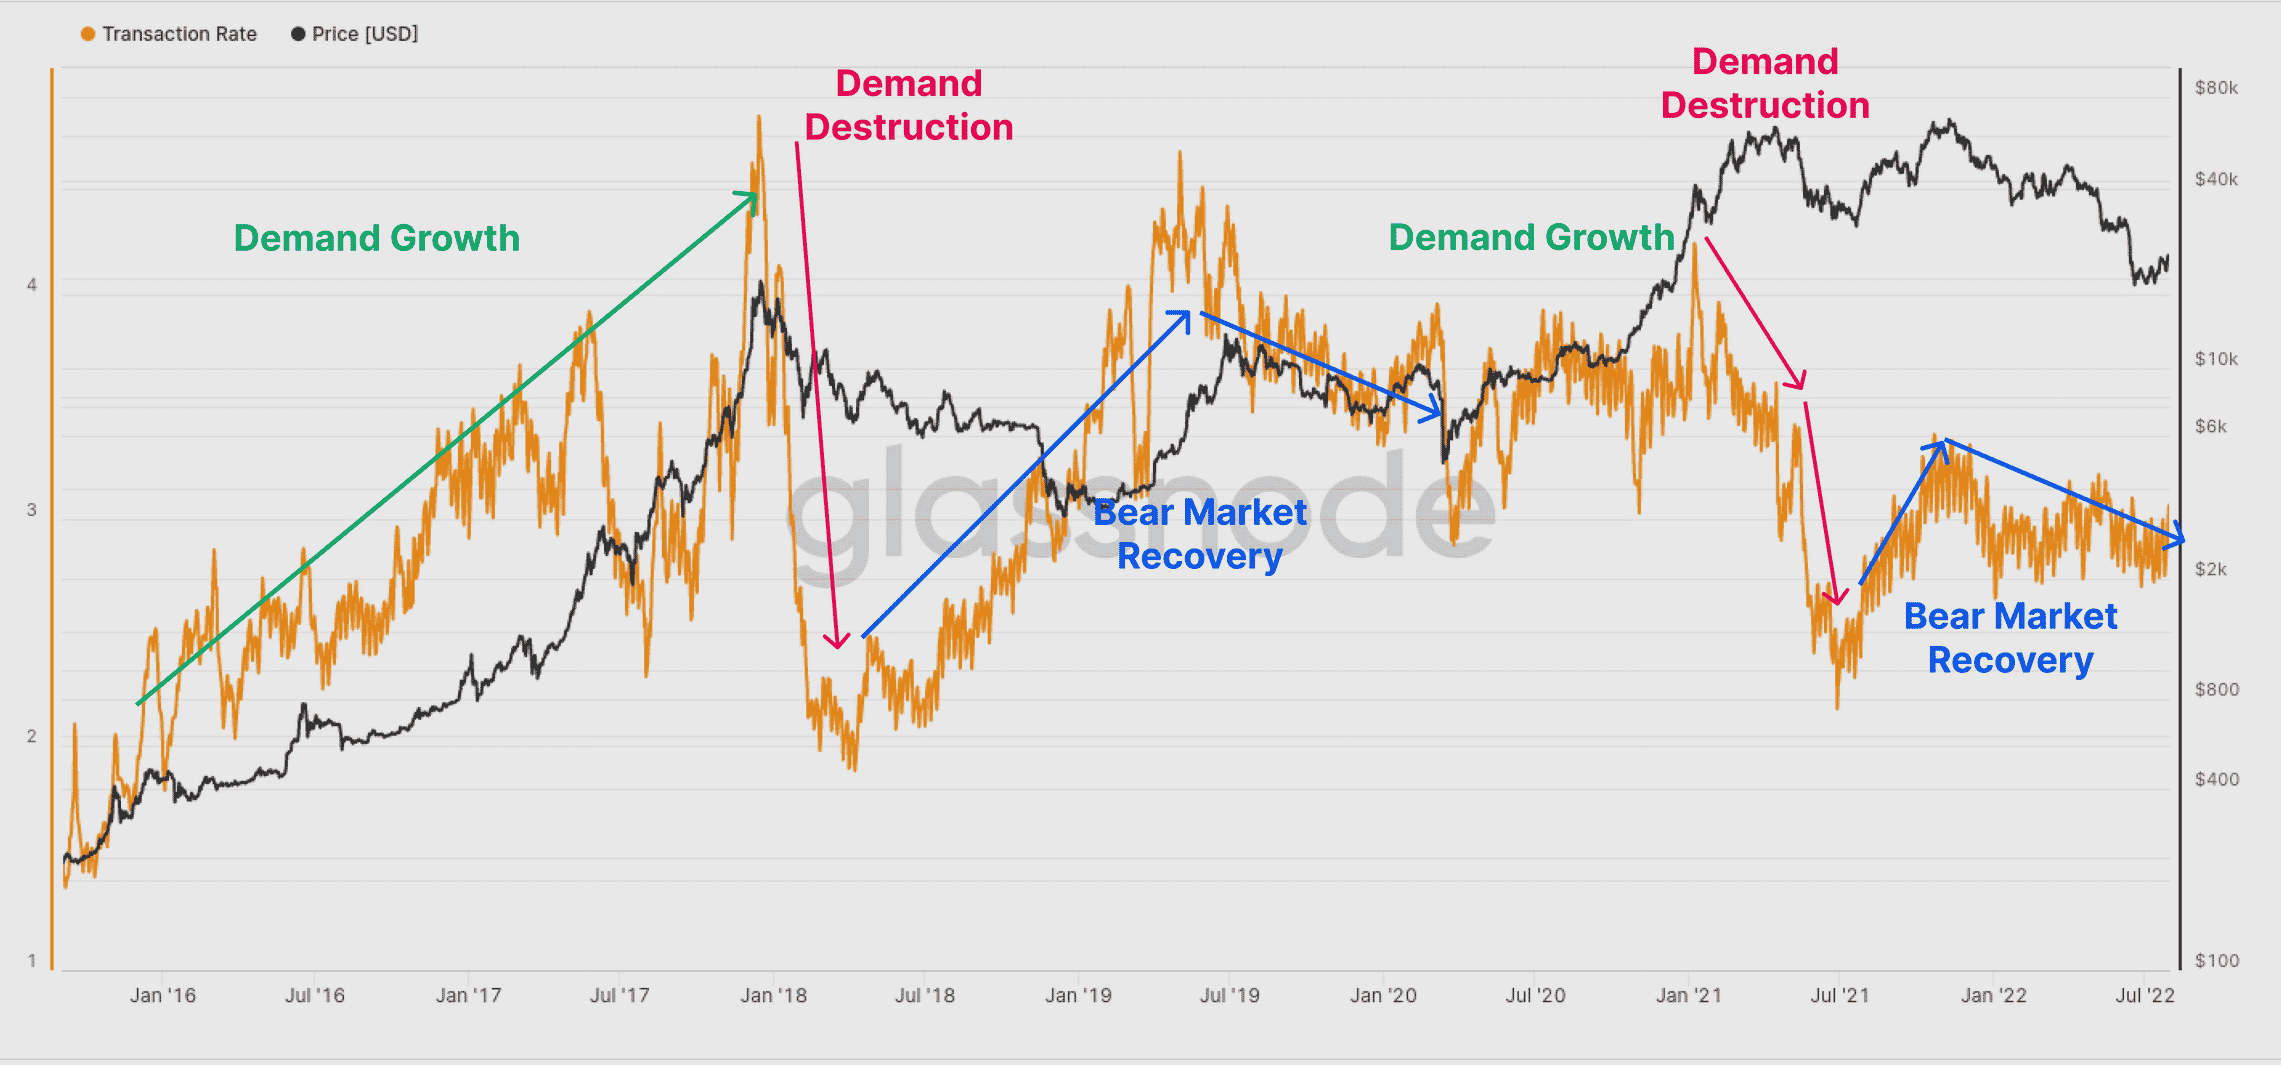
Two more indicators painted a similar sketch- Namely, the number of transactions per second and the total transaction fees.
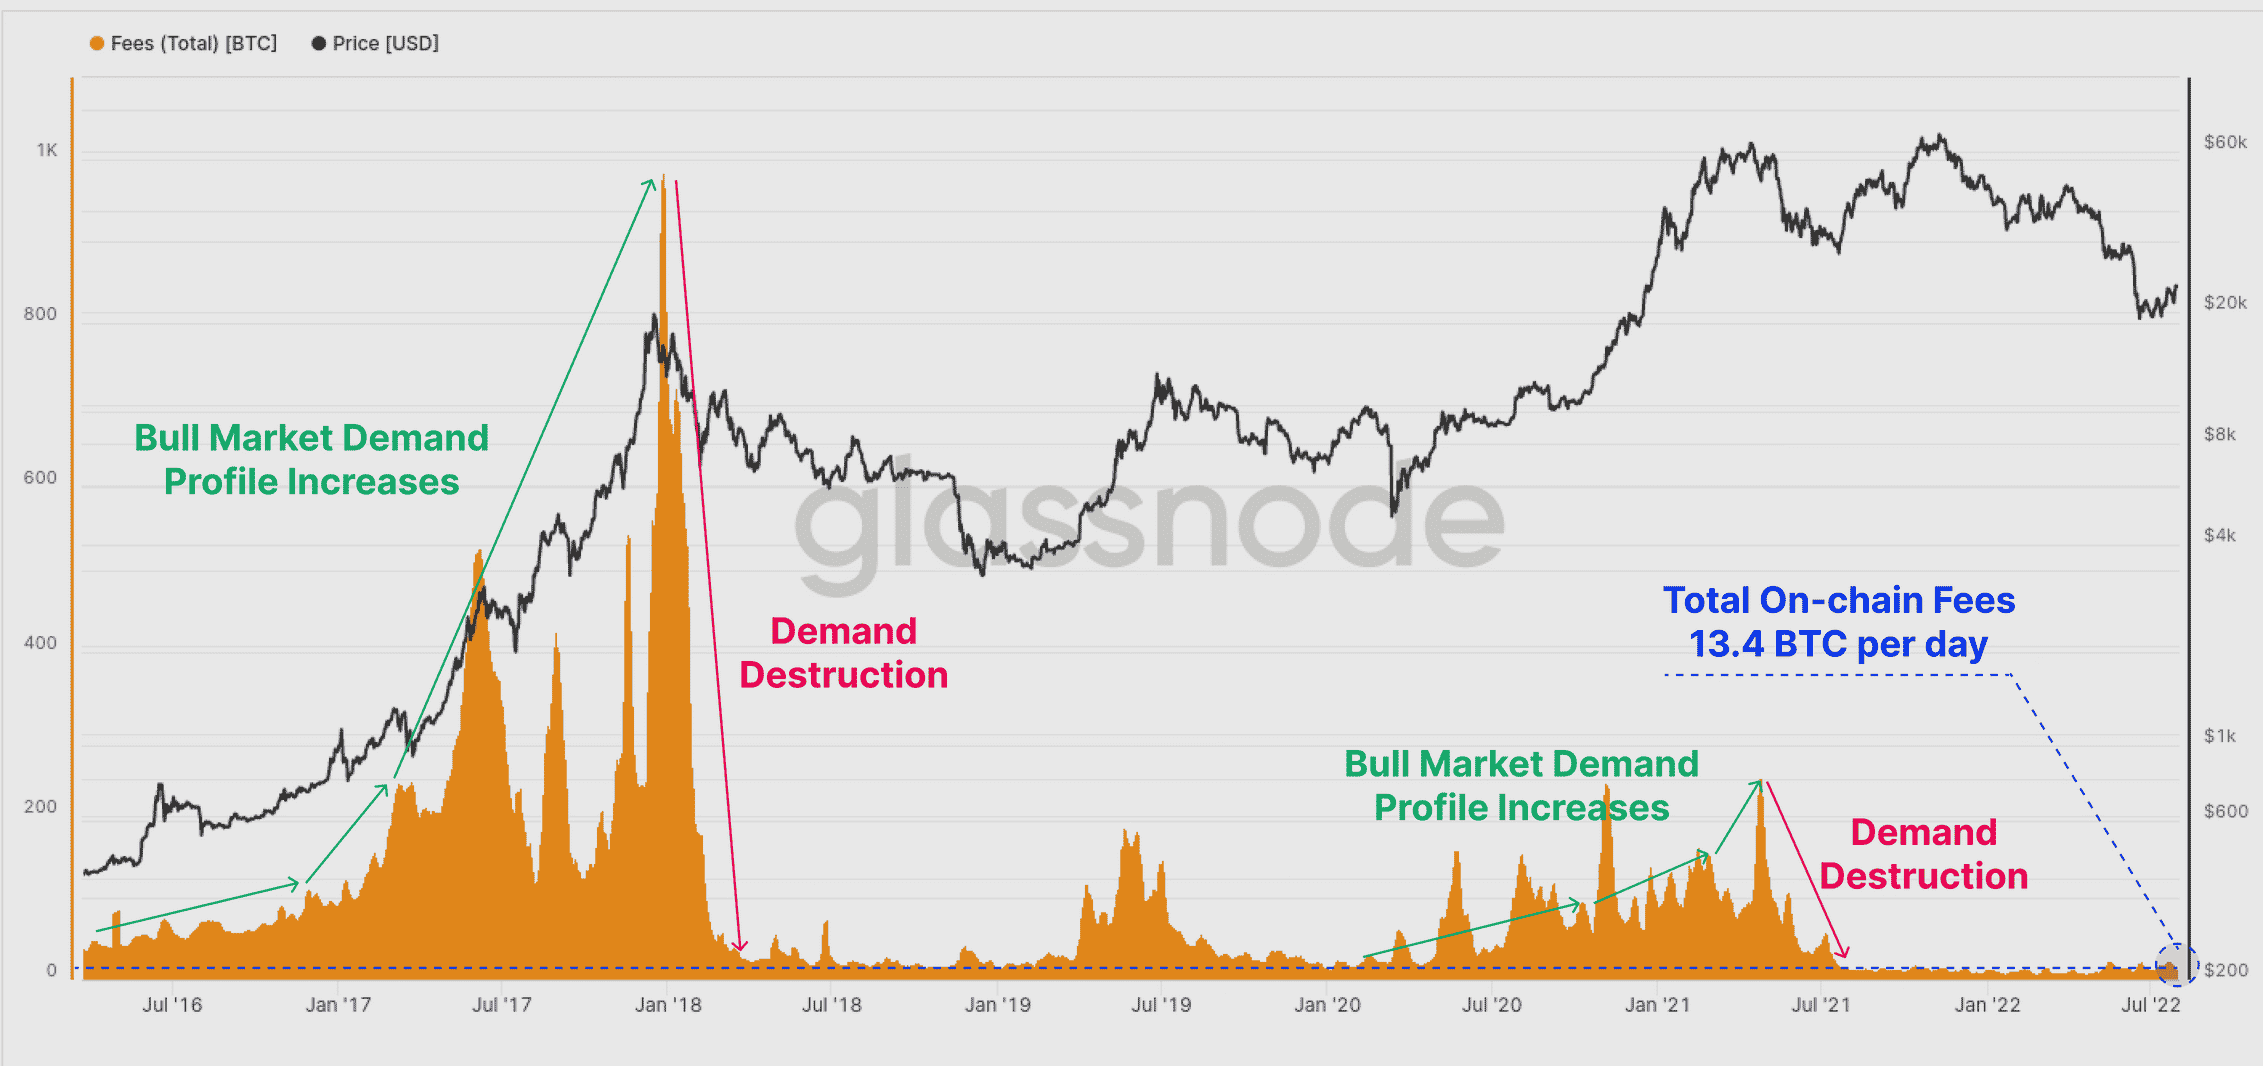
Generally, a bull market showcases elevated fee rates. However, that’s certainly not the case here. The graph below saw no notable uptick in fees. Herein, the on-chain transaction fees, firmly within a bear market territory, saw only 13.4 BTC in total fees paid per day.
For context, when prices reached ATH last April, daily network fees topped 200 BTC.
Even the demand for on-chain transactions had dried up, similar to the one established in the 2018-2019 period.
After the initial wash-out and demand destruction in May 2021, transactional demand traded sideways to slightly lower. It was barely able to overcome the said knockout last year.
In the aforementioned scenario, ‘only the stable base of higher conviction traders and investors remain,’ Glassnode stated. Overall, the report concluded,
“The Bitcoin network remains HODLer dominated, and as yet, there has not been any noteworthy return of new demand, as viewed through the lens of on-chain activity.”
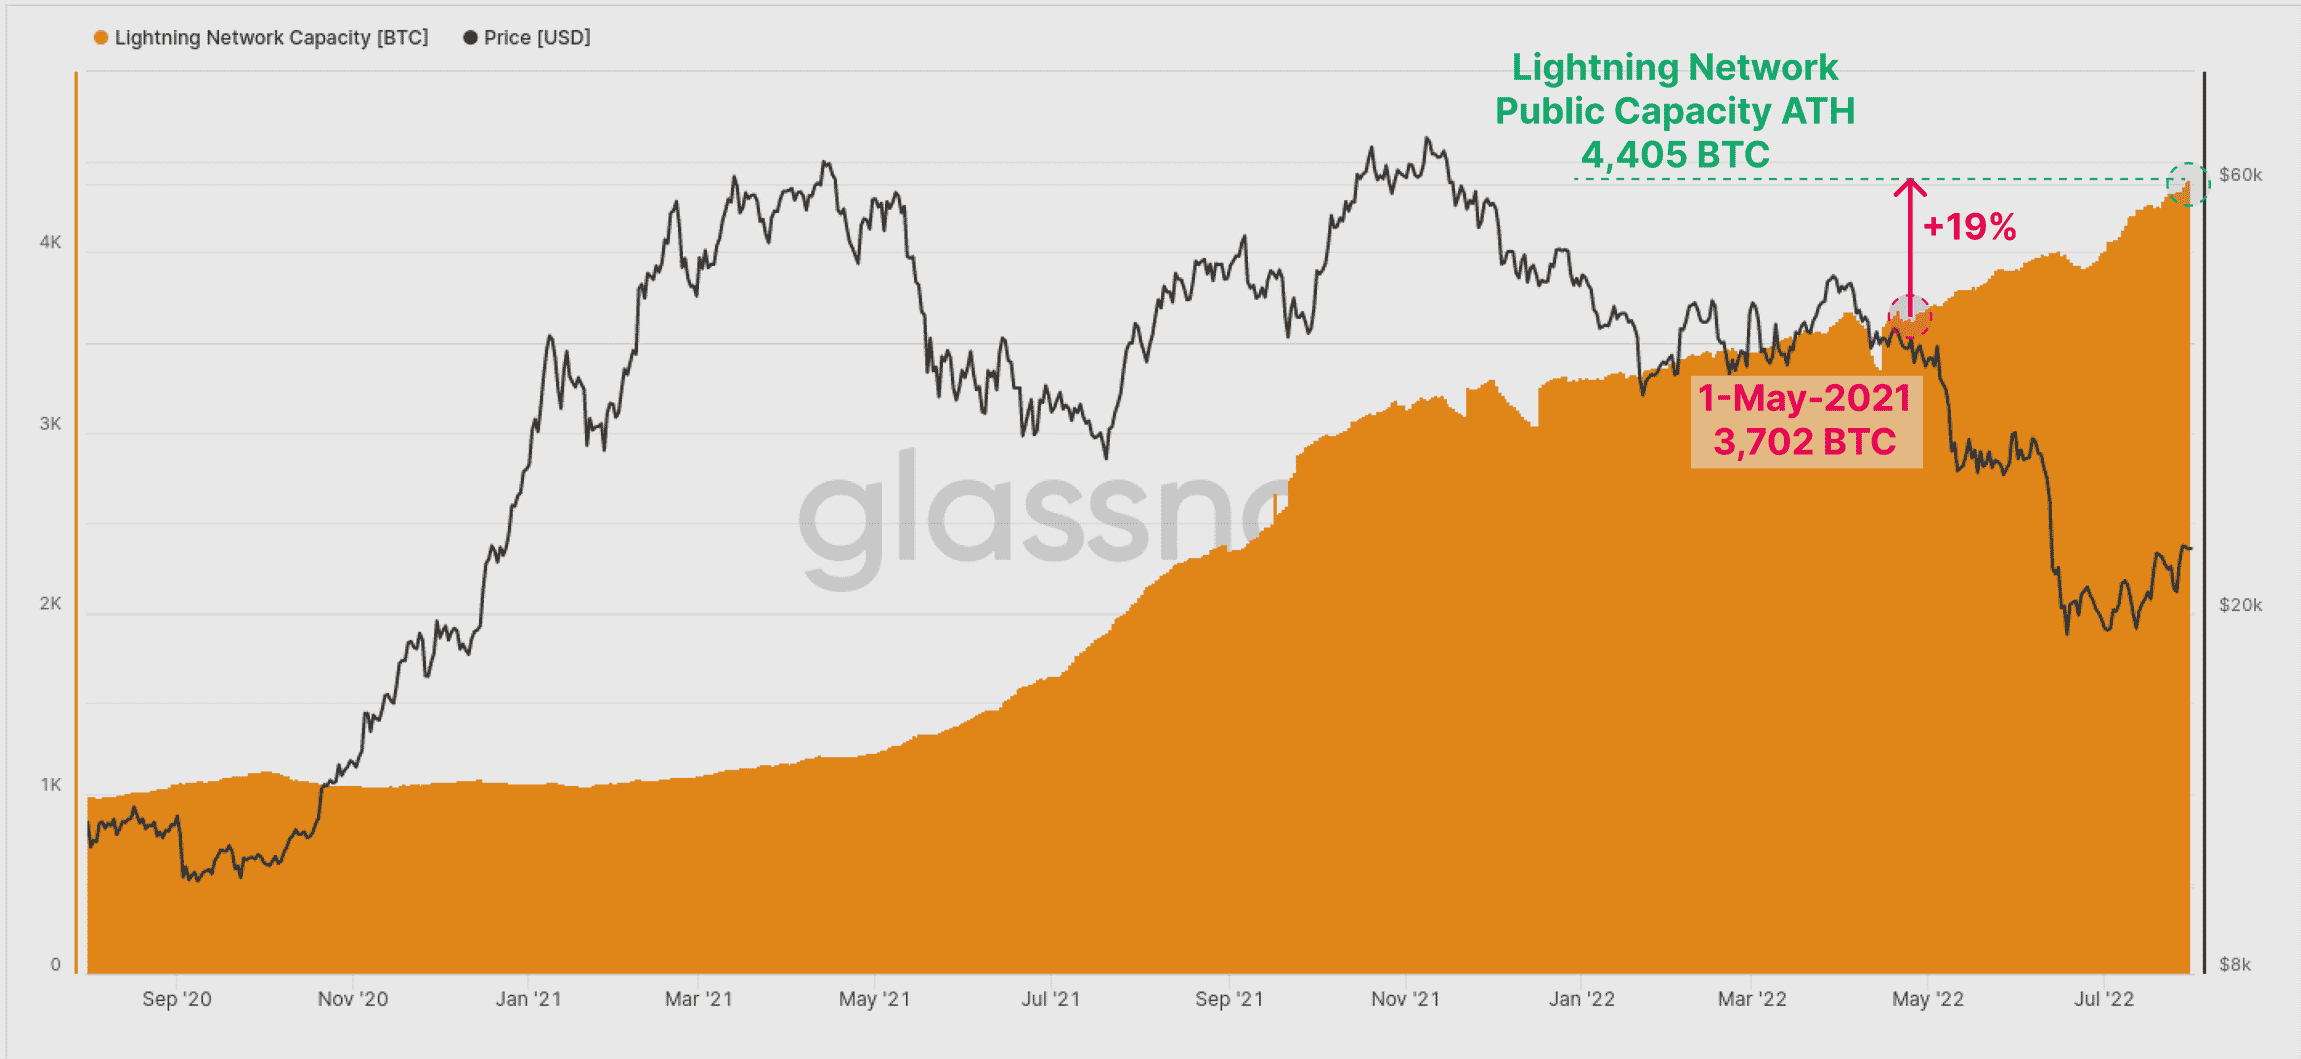
Having said that, one aspect that did see a ray of bright sunshine was the BTC Lightning Network (LN). These channels continued to print new all-time highs.
Moreover, the total LN public capacity reached 4,405 BTC, which is an increase of 19% over the last two months, despite the prevailing bear market.


