
- The volatility in the Bitcoin market has declined significantly.
- AxelAdlerJr, in a new report, found that this has dropped to historical levels.
The Bitcoin [BTC] market currently witnesses low volatility, pseudonymous CryptoQuant analyst AxelAdlerJr has found in a new report.
AxelAdlerJr assessed two of BTC’s key volatility markers and found that they have trended downwards in the past few weeks, suggesting a decline in the possibility of a short-term price swing.
The first metric the analyst observed was BTC’s Garman-Klass Realized Volatility. This metric measures BTC’s price’s historical volatility. It combines the highs, lows, opening, and closing prices of an asset over a specified period to track its volatility during that time.
According to AxelAdlerJr, BTC’s Garman-Klass Realized Volatility has dropped to 20%. When this metric returns low values, it indicates a decrease in the asset’s price volatility.
A historical assessment of the indicator revealed that when its value dropped to this low in the past six years, BTC’s price witnessed significant changes.
Further, the analyst considered BTC’s Volatility Index using a 30-day small moving average (SMA). This metric measures the degree of fluctuations in BTC’s price over a specified period.
Similar to the coin’s Garman-Klass Realized Volatility, BTC’s Volatility Index has also declined, confirming the low volatility in the leading coin’s market.
According to the CryptoQuant’s analyst, the index’s value has dropped to extremely low levels, “which have only been seen four times in the last six years.”
BTC’s price swings are minimal
AMBCrypto’s assessment of the coin’s Bollinger Bands and Average True Range confirmed the analyst’s positions.
Readings from BTC’s Bollinger Bands showed a narrowing gap between the indicator’s upper and lower bands. This happens during a period of reduced price swings.
BTC’s declining Average True Range (ATR) confirmed this trend. This indicator measures market volatility by calculating the average range between high and low prices over a specified number of periods.
Read Bitcoin’s [BTC] Price Prediction 2024-2025
When the indicator falls, it suggests lower market volatility and hints that the asset’s price is trending within a range. At 2138.35 at press time, BTC’s ATR has declined by 44% since 19 April.
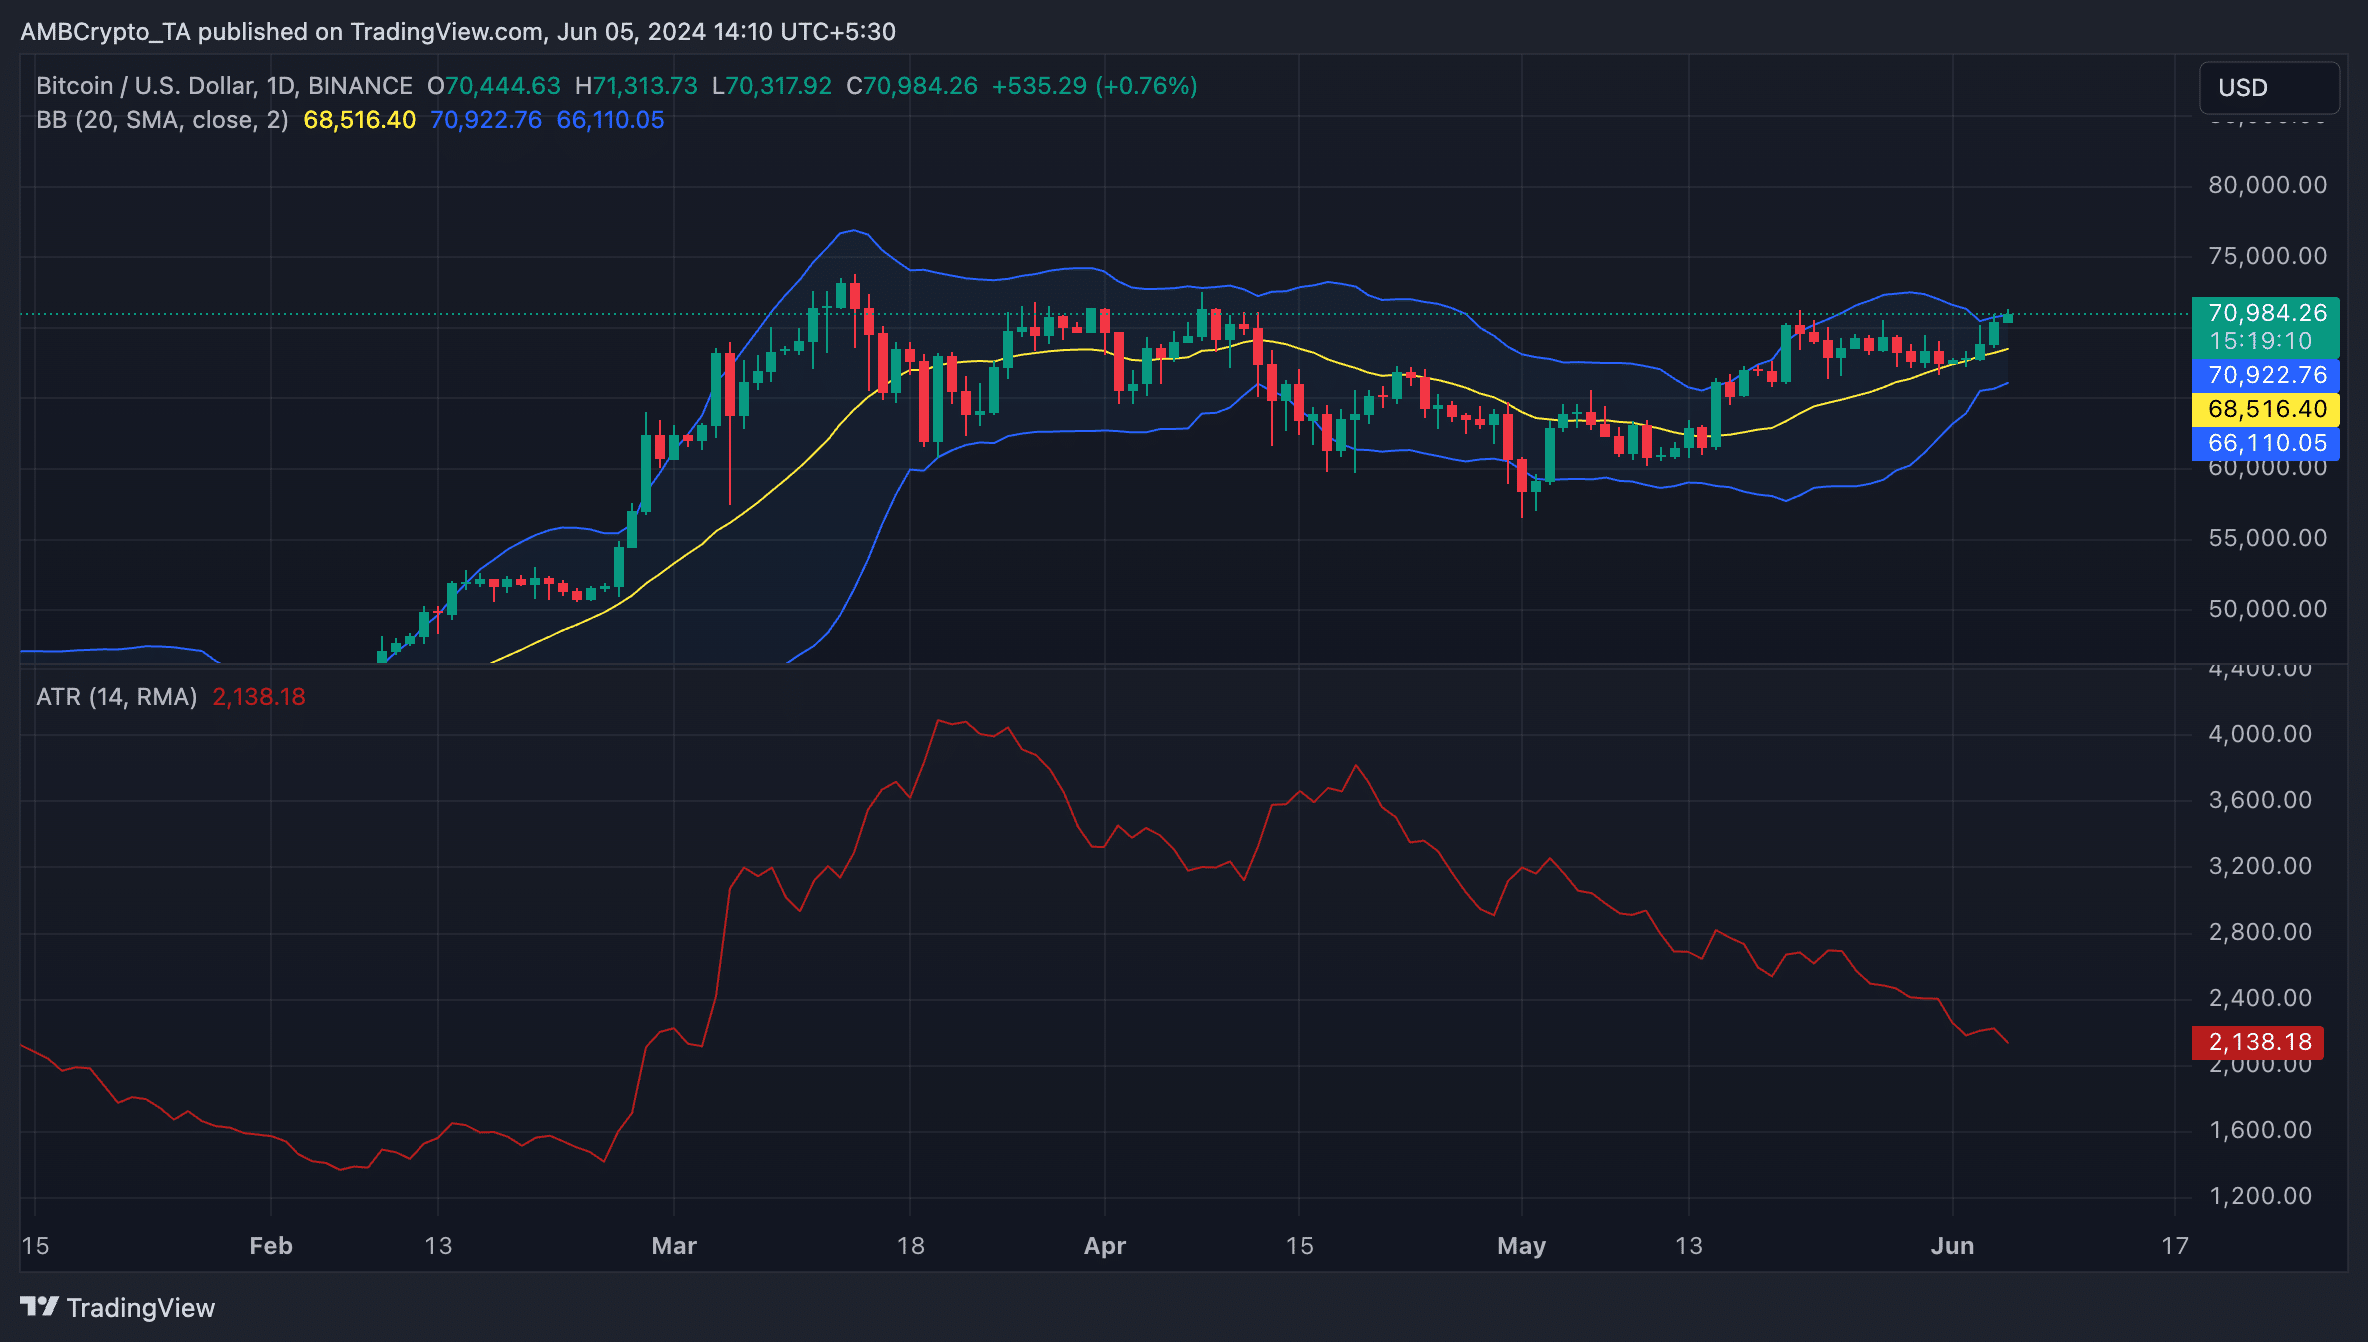
Source: BTC/USDT on TradingView
According to AxelAdlerJr, the current low volatility in the BTC market is a good sign. “
“Given that the market’s current structure remains bullish and that the end of the low volatility period could be followed by a strong price movement, it can be concluded that the market is in the process of forming a new bullish trend,” the analyst added.