Bitcoin fated to head lower as price charts highlight weakness
The negative correlation between Bitcoin and stock market indices showed that despite buyer strength in traditional finance, BTC saw a notable lack of demand.

Disclaimer: The information presented does not constitute financial, investment, trading, or other types of advice and is solely the writer’s opinion.
- The daily timeframe price action showed a bearish structure.
- The Fibonacci retracement levels hinted that further losses were likely for BTC.
In the past two weeks, Bitcoin [BTC] has traded at the $29k-$29.2k region. There was lowered volatility during this period, except for the spike to $30k on 1 and 2 August and the subsequent retracement.
Read Bitcoin’s [BTC] Price Prediction 2023-24
At the time of writing, Bitcoin was yet to close a daily trading session below $29k. But the recent rejection from the $30k area showed bearish intent.
A rise in selling pressure could take BTC toward the $26k demand zone
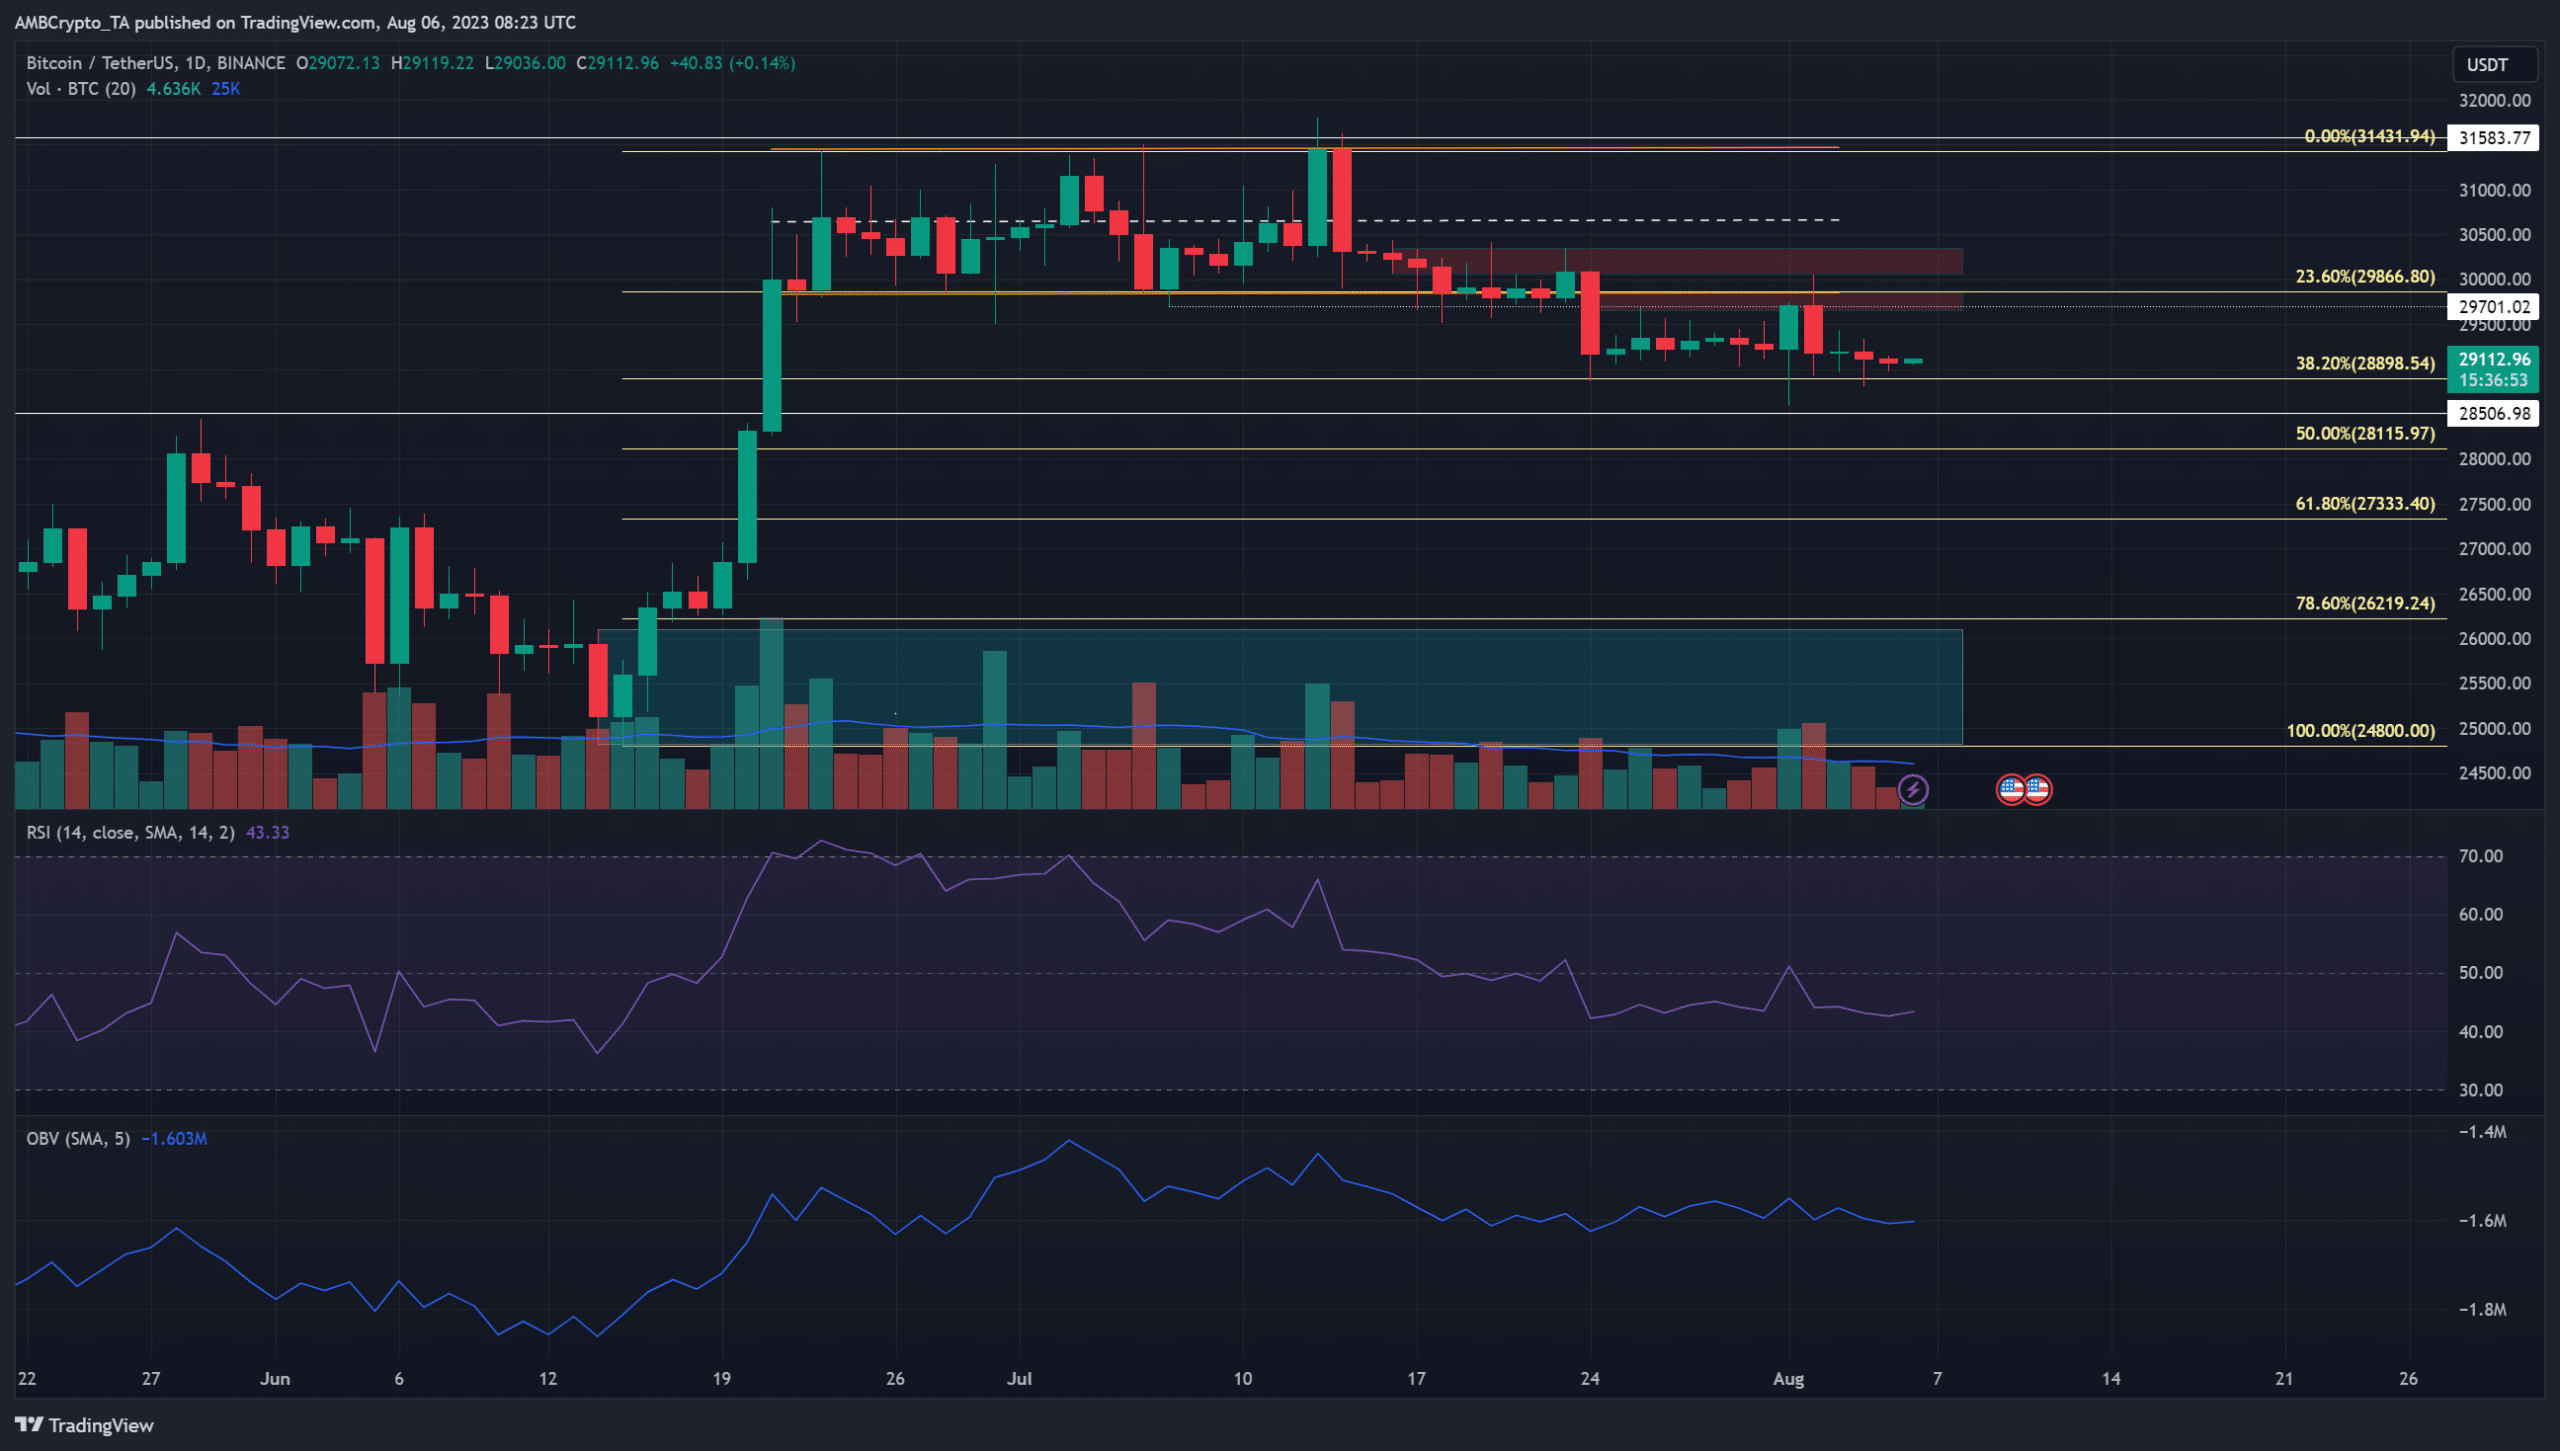
The negative correlation between Bitcoin and stock market indices showed that despite buyer strength in traditional finance, BTC saw a notable lack of demand. The RSI showed bearish momentum on the rise since 24 July and has remained below neutral 50.
The OBV was relatively flat over the past two weeks but has slowly trended downward since early July. On the price action front, the market structure of BTC was bearish on the daily timeframe. The $30.2k and $29.7k regions highlighted in red were shorter timeframe resistance zones.
To the south, a bullish order block sat at the $25k area, marked in cyan. A set of Fibonacci retracement levels (yellow) showed the 61.8% and 78.6% retracement levels sat at $27.3k and $26.2k. Hence, a bounce from these levels after a retracement was a possibility.
Exchange flow showed added withdrawals in the past week

The age consumed metric of Bitcoin saw occasional spikes in July, with the most recent one on 27 July, but nothing significant since then. The active addresses count stayed stable in recent days, showing good network participation from users.
Is your portfolio green? Check the Bitcoin Profit Calculator
The exchange flow balance showed outflows over the past four days. This showed that investors were withdrawing BTC from exchanges, which hinted at accumulation.
The evidence showed bearish pressure was more likely for Bitcoin in the coming weeks. This bearish idea would be invalidated if Bitcoin can climb above the $30k level and flip the $30.2k zone to support.