- Futures trading in Bitcoin dominated the market, outweighing spot trading volume.
- The current Bitcoin Volatility Index indicated high volatility, with traders taking long and short positions in response.
Fresh statistics shed light on the enormous amount of trading activity in both Bitcoin [BTC] spots and futures markets. The statistics suggested that BTC volatility could be soaring. By scrutinizing the present discrepancy, and assessing the BTC volatility index, the situation at hand can be further understood.
Read Bitcoin (BTC) Price Prediction 2023-24
Bitcoin futures exceeds spots
According to a report by CryptoQuant, the current futures trading volume was more than the spots trading volume. The latest data on Bitcoin’s spot and futures trading volumes indicated a significant disparity.

As of this writing, the chart revealed that spot trading volume was a mere 35,000, whereas derivatives trading volume exceeded 369,000. On 28 April, the situation was even more pronounced, with spot trading volume hovering around 92,000 while derivatives trading volume reaching nearly 900,000.
These figures indicated the predominance of futures trading in the BTC market, making the market more responsive to price fluctuations.
In Bitcoin trading, the spot market is the conventional method where individuals can purchase or sell BTC directly. On the other hand, the futures market is where investors speculate on the future value of BTC.
Unlike the spot market, where one owns Bitcoin outright, futures traders enter into a contract to buy or sell Bitcoin at a predetermined price on a specific date in the future.
Current Bitcoin volatility measure
According to data from Glassnode, the current Bitcoin Volatility Index has surpassed the 60% mark. It stood at 67.8% as of this writing and indicated a possible uptrend in volatility.
The chart recorded two significant spikes in the index in 2023 – on 5 February, at a staggering 93%, and on 10 April, at 83%.

The BTC Volatility Index is a crucial metric that gauges the extent of fluctuations in BTC’s price over time.
It derives from the implied volatility of Bitcoin options, which are financial instruments that allow the holder the right, but not the obligation, to buy or sell BTC at a predetermined price and time.
How much are 1,10,100 BTCs worth today
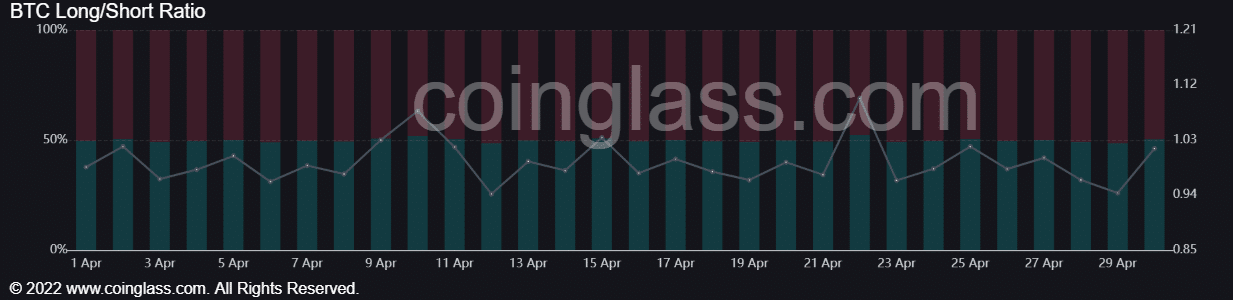
Long vs. shorts
Coinglass data indicated that traders were actively taking long and short positions in response to the current volatility of BTC. As of this writing, the percentage of long positions stood at 50.4%, while short positions accounted for 49.6% – indicating a nearly equal distribution between the two.
Moreover, BTC was trading at around $29,200 at press time, with a slight gain observed. Traders are responding strategically to the recent volatility in the Bitcoin market, seeking to maximize their profits while minimizing the risks.