Bitcoin: Getting ‘stuck’ within this bracket is what’s next for BTC

Bitcoin’s price has shattered its immediate hurdles and pushed past the yearly open, suggesting that the bulls are back. However, a closer look reveals that while the bulls may be back, the sellers are not going to give up easily. Therefore, investors can expect another consolidation to happen after a tiny leg-up.
Hopes of a full-fledged bull run
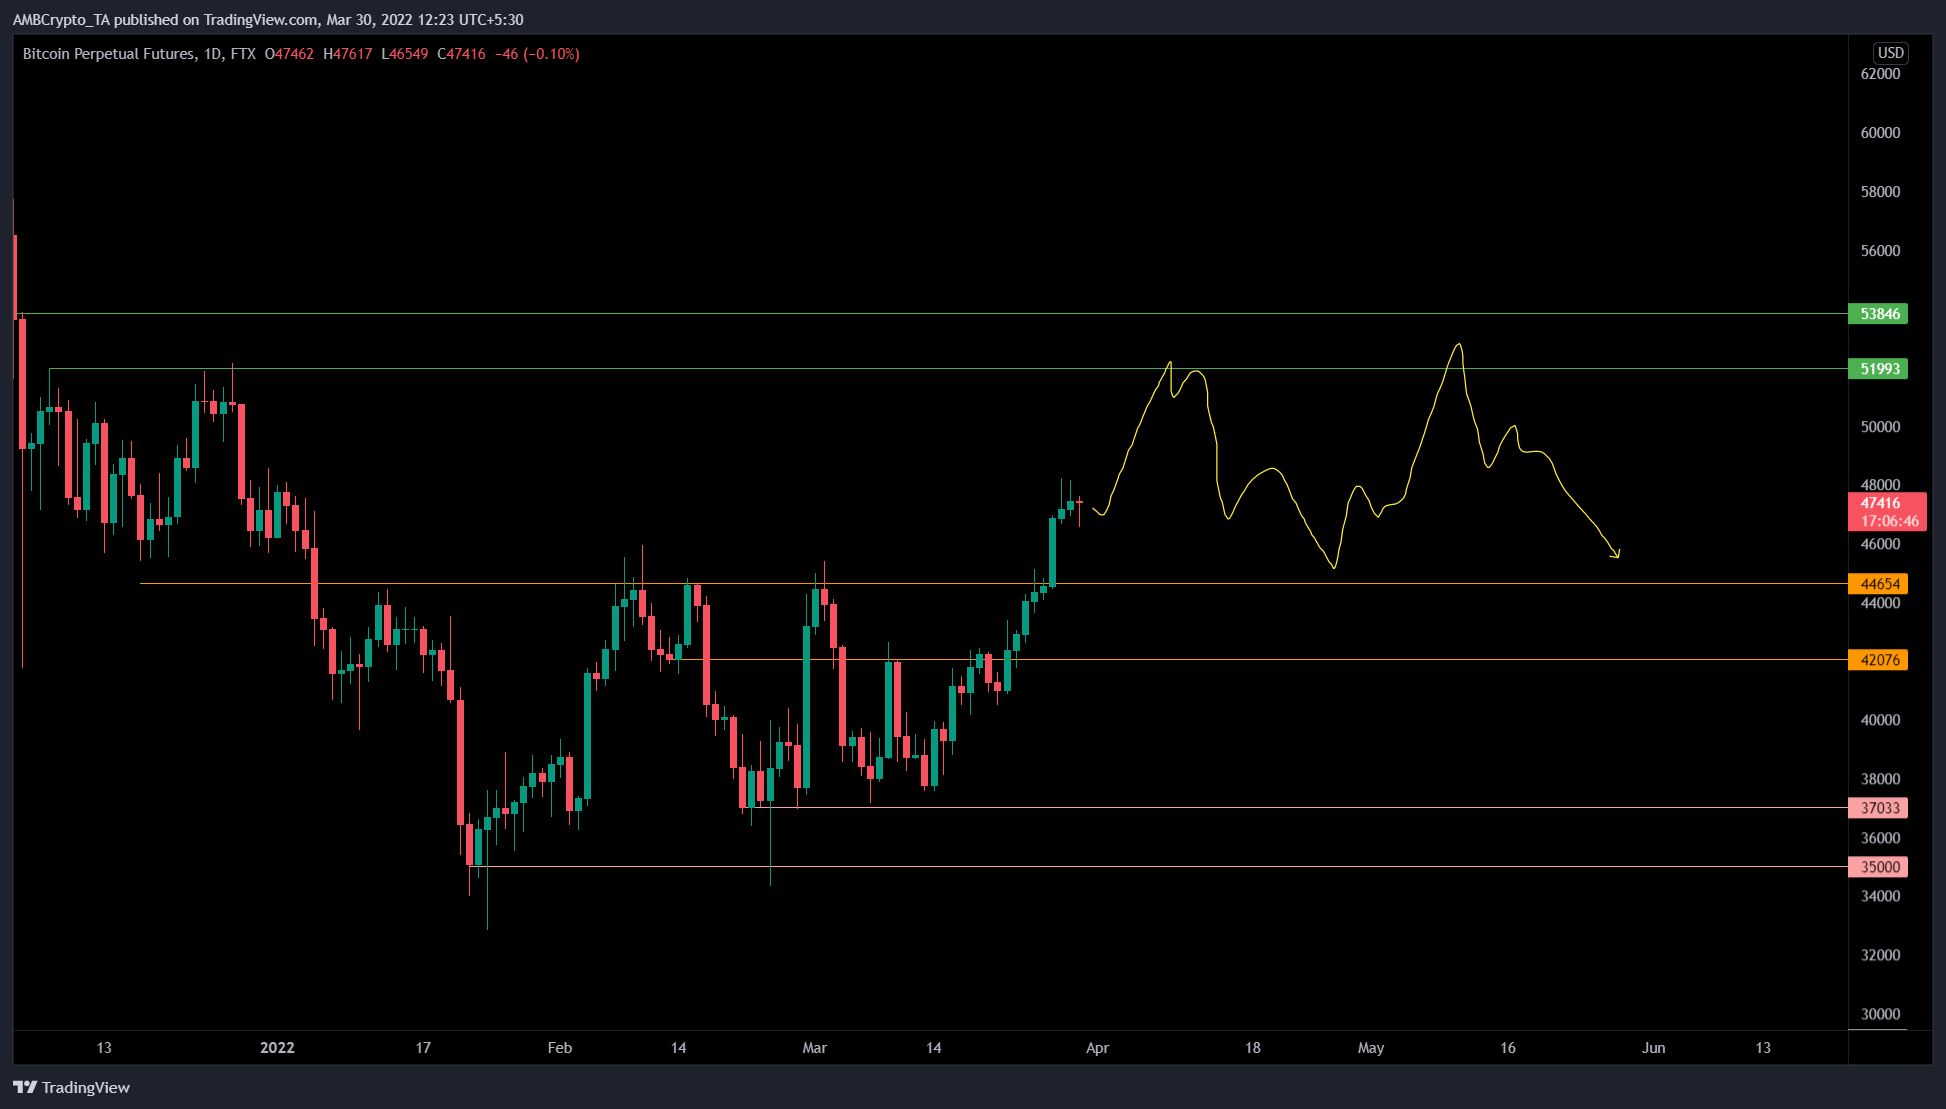
Bitcoin’s price has three major areas of support, as shown in the chart below. The first area extends from $52,000 to $53,486, the second from 42,076 to $44,654, and the last one from $35,000 to $37,033.
The latest move has shattered the second area, with the crypto hovering below the first area of resistance. Going forward, investors can expect BTC’s price to retest the upper limit and bracket between these areas.
The sideways movement, while boring for traders, will be a key in triggering massive rallies for altcoins. Regardless, a weekly close above $53,486 will create a higher high and suggest the start of a bull run. In such a case, market participants need to wait for a higher low around $45,000 to start accumulating.
However, a failure to move past the $54,000-barrier will push the big crypto back into the consolidation phase.
MVRV says aye?
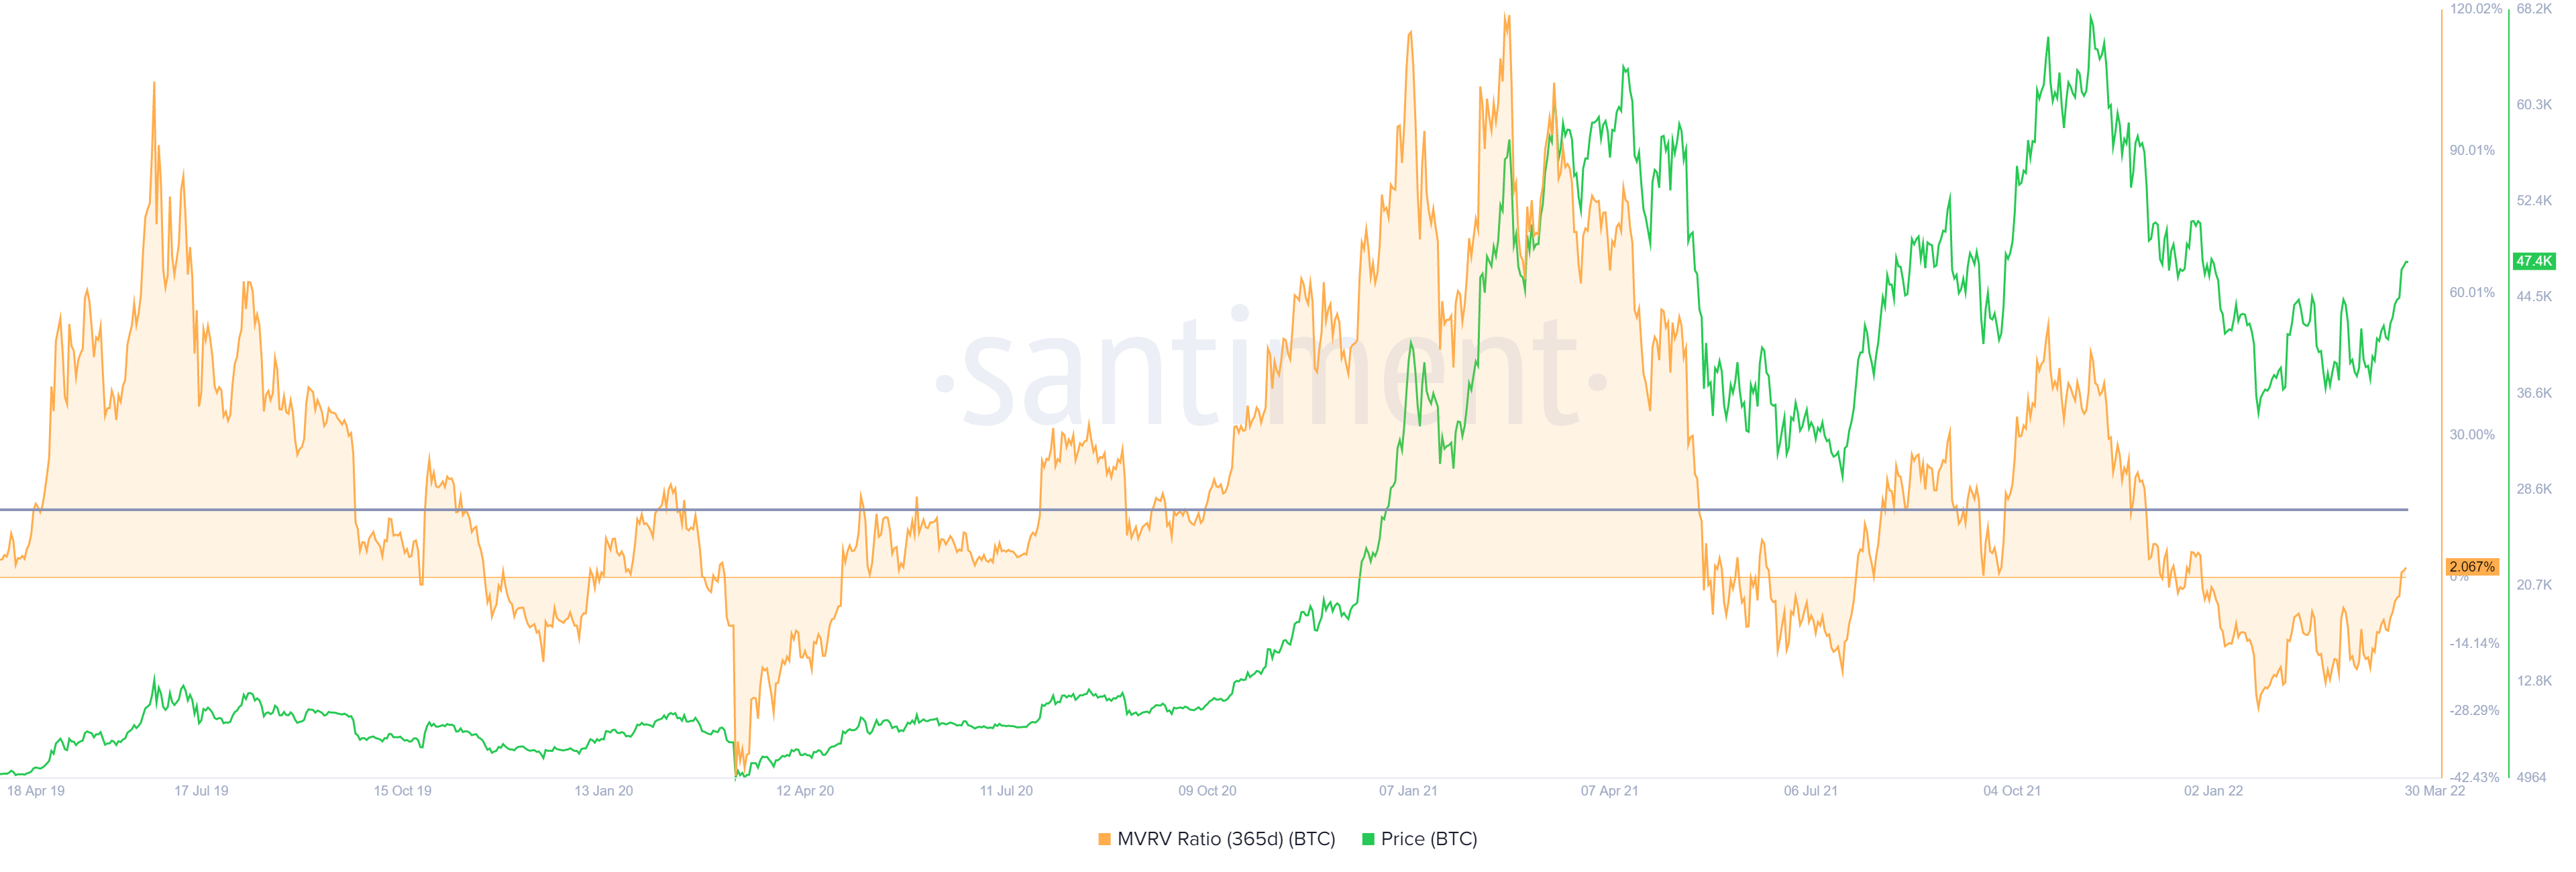
Supporting this move to $53,486 and a retracement back to the lower limit at $44,654 for the price is the 365-day Market Value to Realized Value (MVRV) model. This indicator is used to assess the average profit/loss of investors who purchased BTC tokens over the past year.
While a negative value below -10% indicates that short-term holders are at a loss, it is typically a place where long-term holders accumulate. Therefore, a value below -10% is often referred to as an “opportunity zone.”
However, the MVRV chart revealed that BTC has flipped above the zero-line and is currently hovering around 2%. So, there isn’t a danger zone or an opportunity zone. However, looking at the three-year history shows that the price has often hit a local top when the 365-day MVRV goes above 15%.
This observation reveals that there is more room for BTC to head higher. This also coincides with the outlook represented from a technical perspective.
If BTC’s price produces a daily candlestick close below $35,000, it will invalidate the bullish thesis and trigger a crash to $30,000 or lower.


