Bitcoin: History doesn’t mirror itself perfectly BUT…

Bitcoin began 2021 with a rally and surged higher, hitting an all-time peak of $64,863 in April. But within just six weeks between April and May, BTC plummeted from this record high to less than half its value. Over the past few weeks, it has been stalling around resistance levels of $32 K – $35K.
Along with these price changes, investor sentiments keep shifting between enthusiasm and dissatisfaction; and this trend has been observed in the past too. So does history mirror itself perfectly?
The trader who goes by the pseudonym Kaleo, in a tweetstorm looked at potential similarities between Bitcoin’s chart from July of 2020 and the current period. The analyst with over 334k followers, shed light on last year’s trajectory for the coin, by stating,
“Just a reminder that one year ago everyone thought BTC looked terrible also. The sane thing to do was to take profit before it crashed back down below $6K even though tech was running wild. It didn’t take long for the narrative to change.”
This illustration explains the same, injecting some optimism amidst continued chaos in the markets.
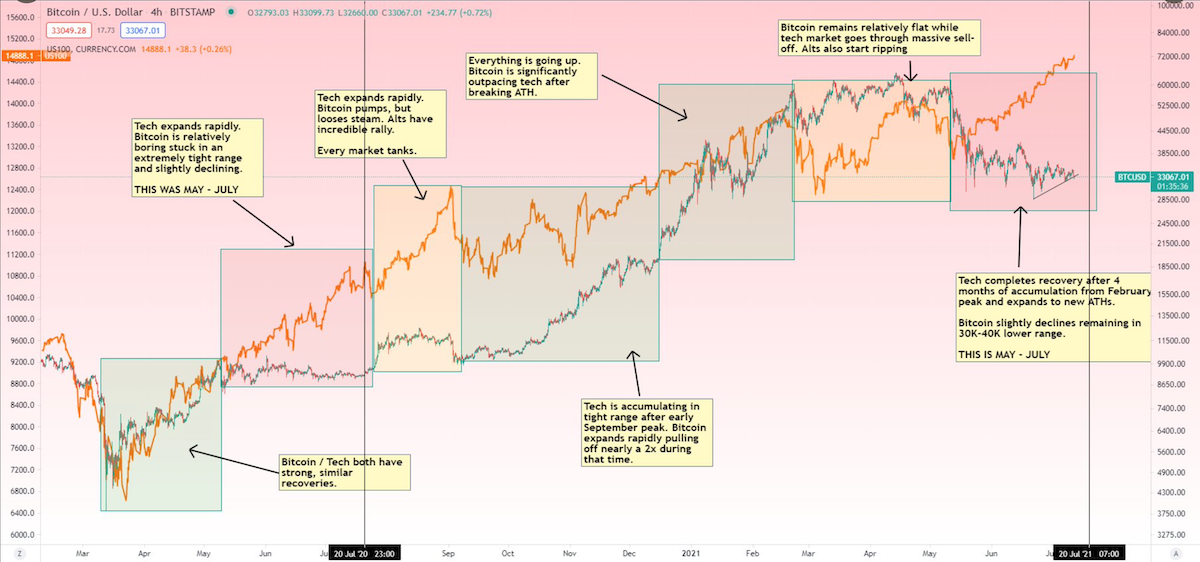
In addition to this, the crypto analyst also put forward an interesting perspective comparing the bearish scenarios in mid-July, of 2020 and 2021 respectively. “The chart looked terrible from July 9th through the 20th especially,” he said.
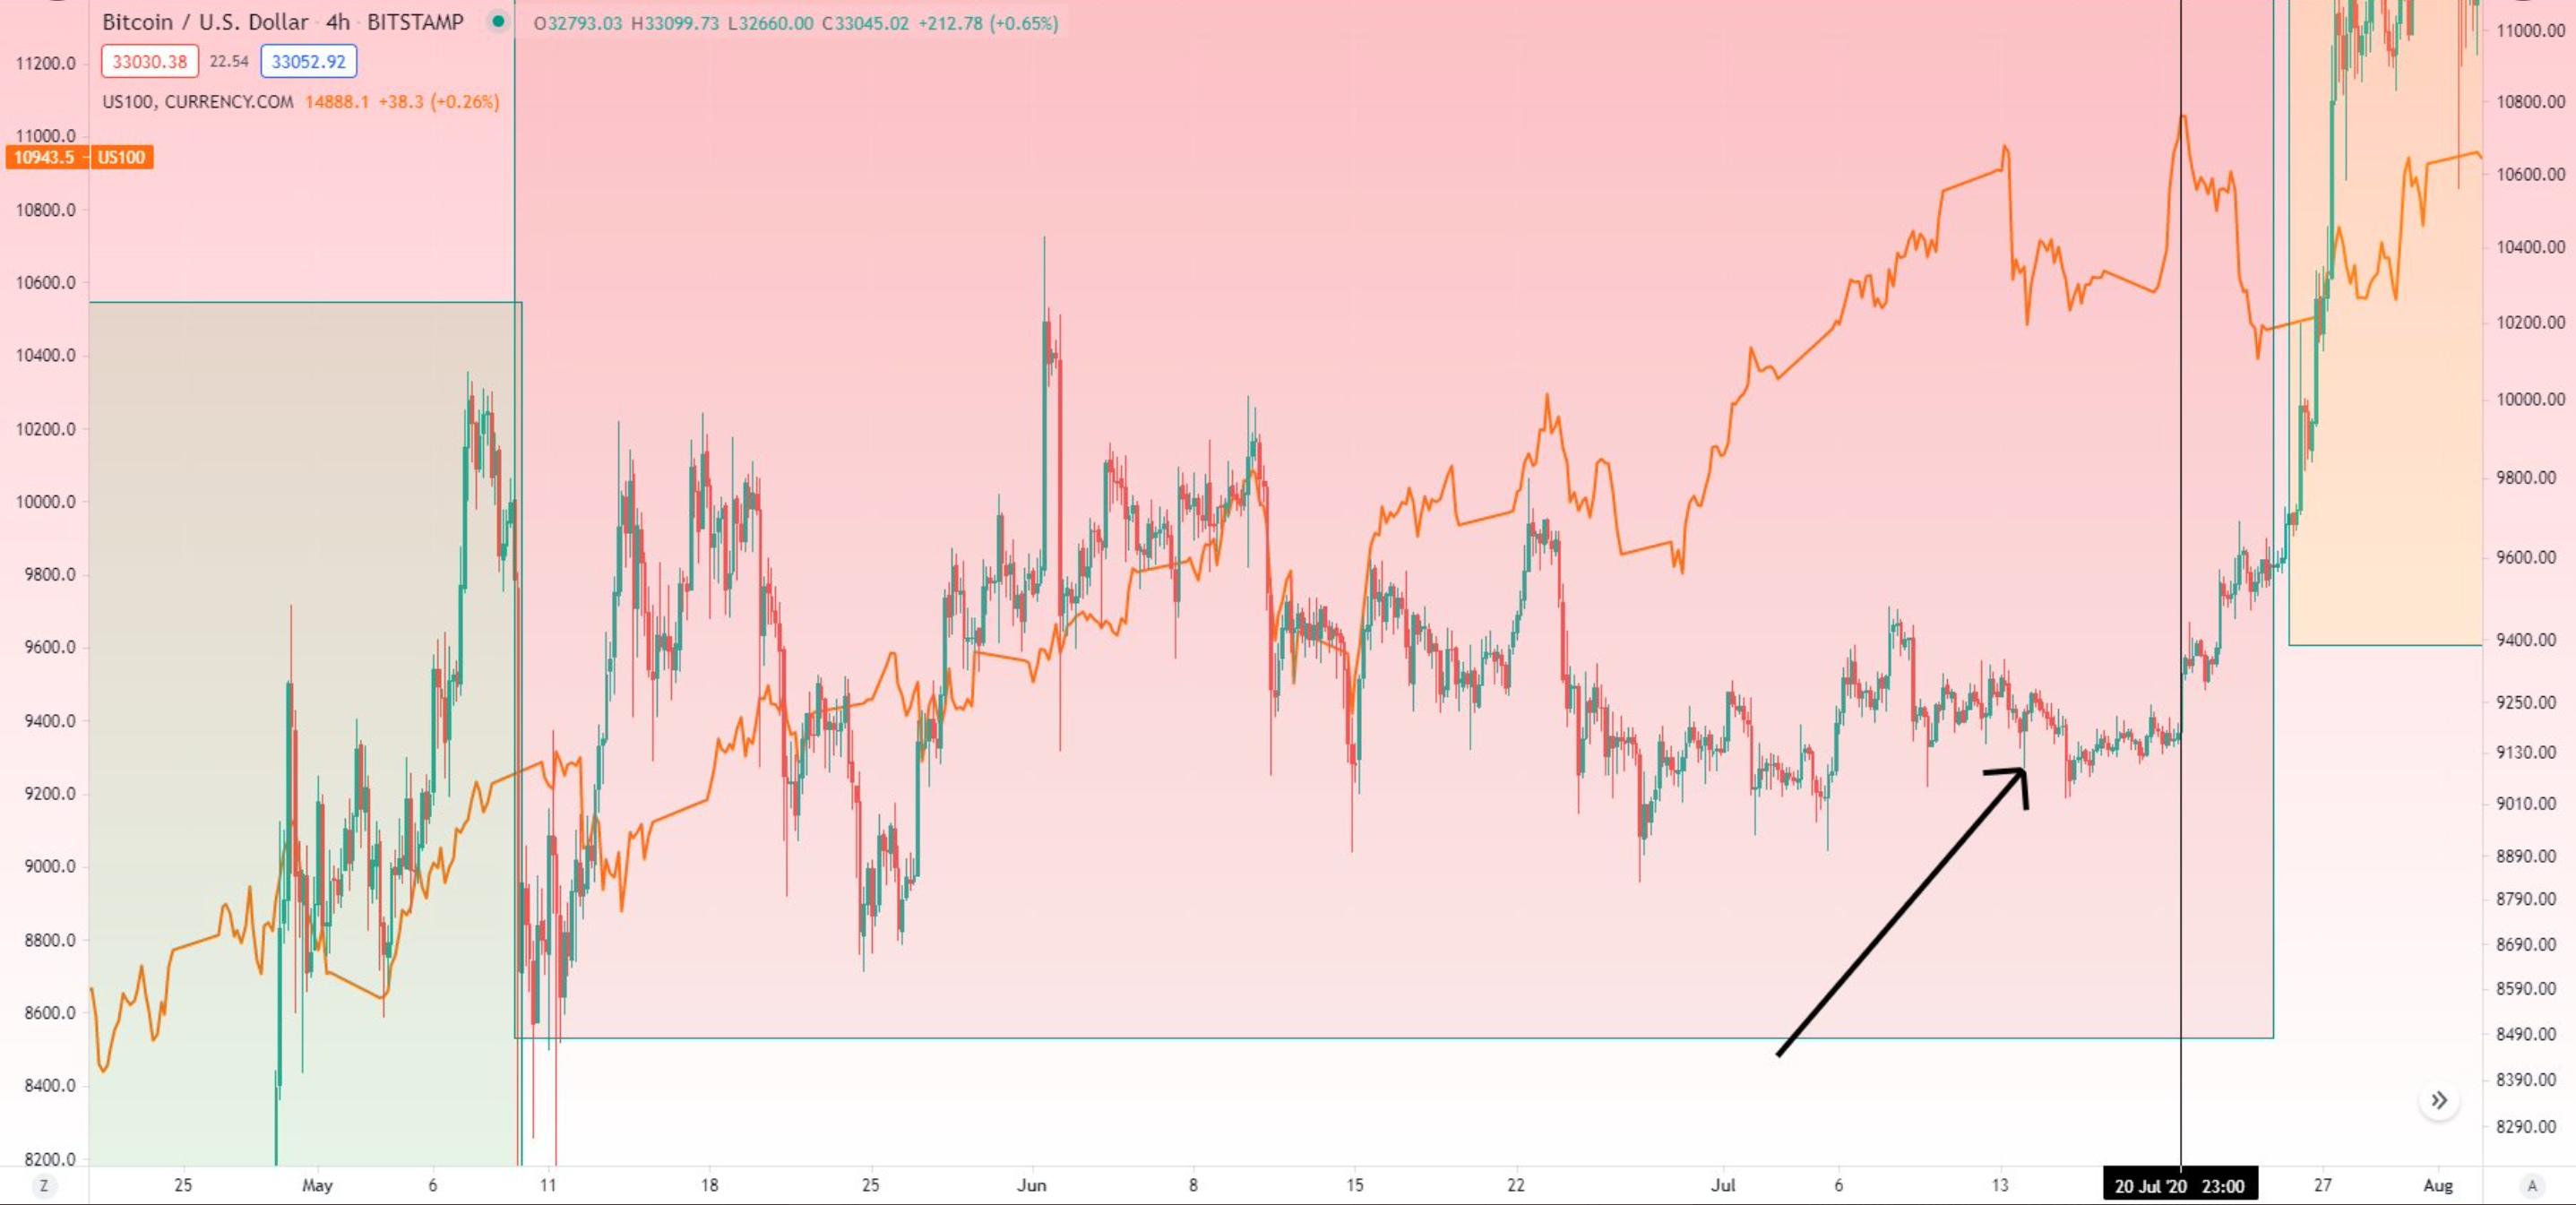
However, as seen above, the coin did surge hard thereafter, to overcome this bearish phase.
Now, with regards to the question, while using the same analogy, whether there are any chances of history mirroring itself perfectly at this point, to showcase a price recovery, Kaleo said,
“This isn’t to say that history mirrors itself perfectly, but it often rhymes.”
This chart is representative of the current phase.
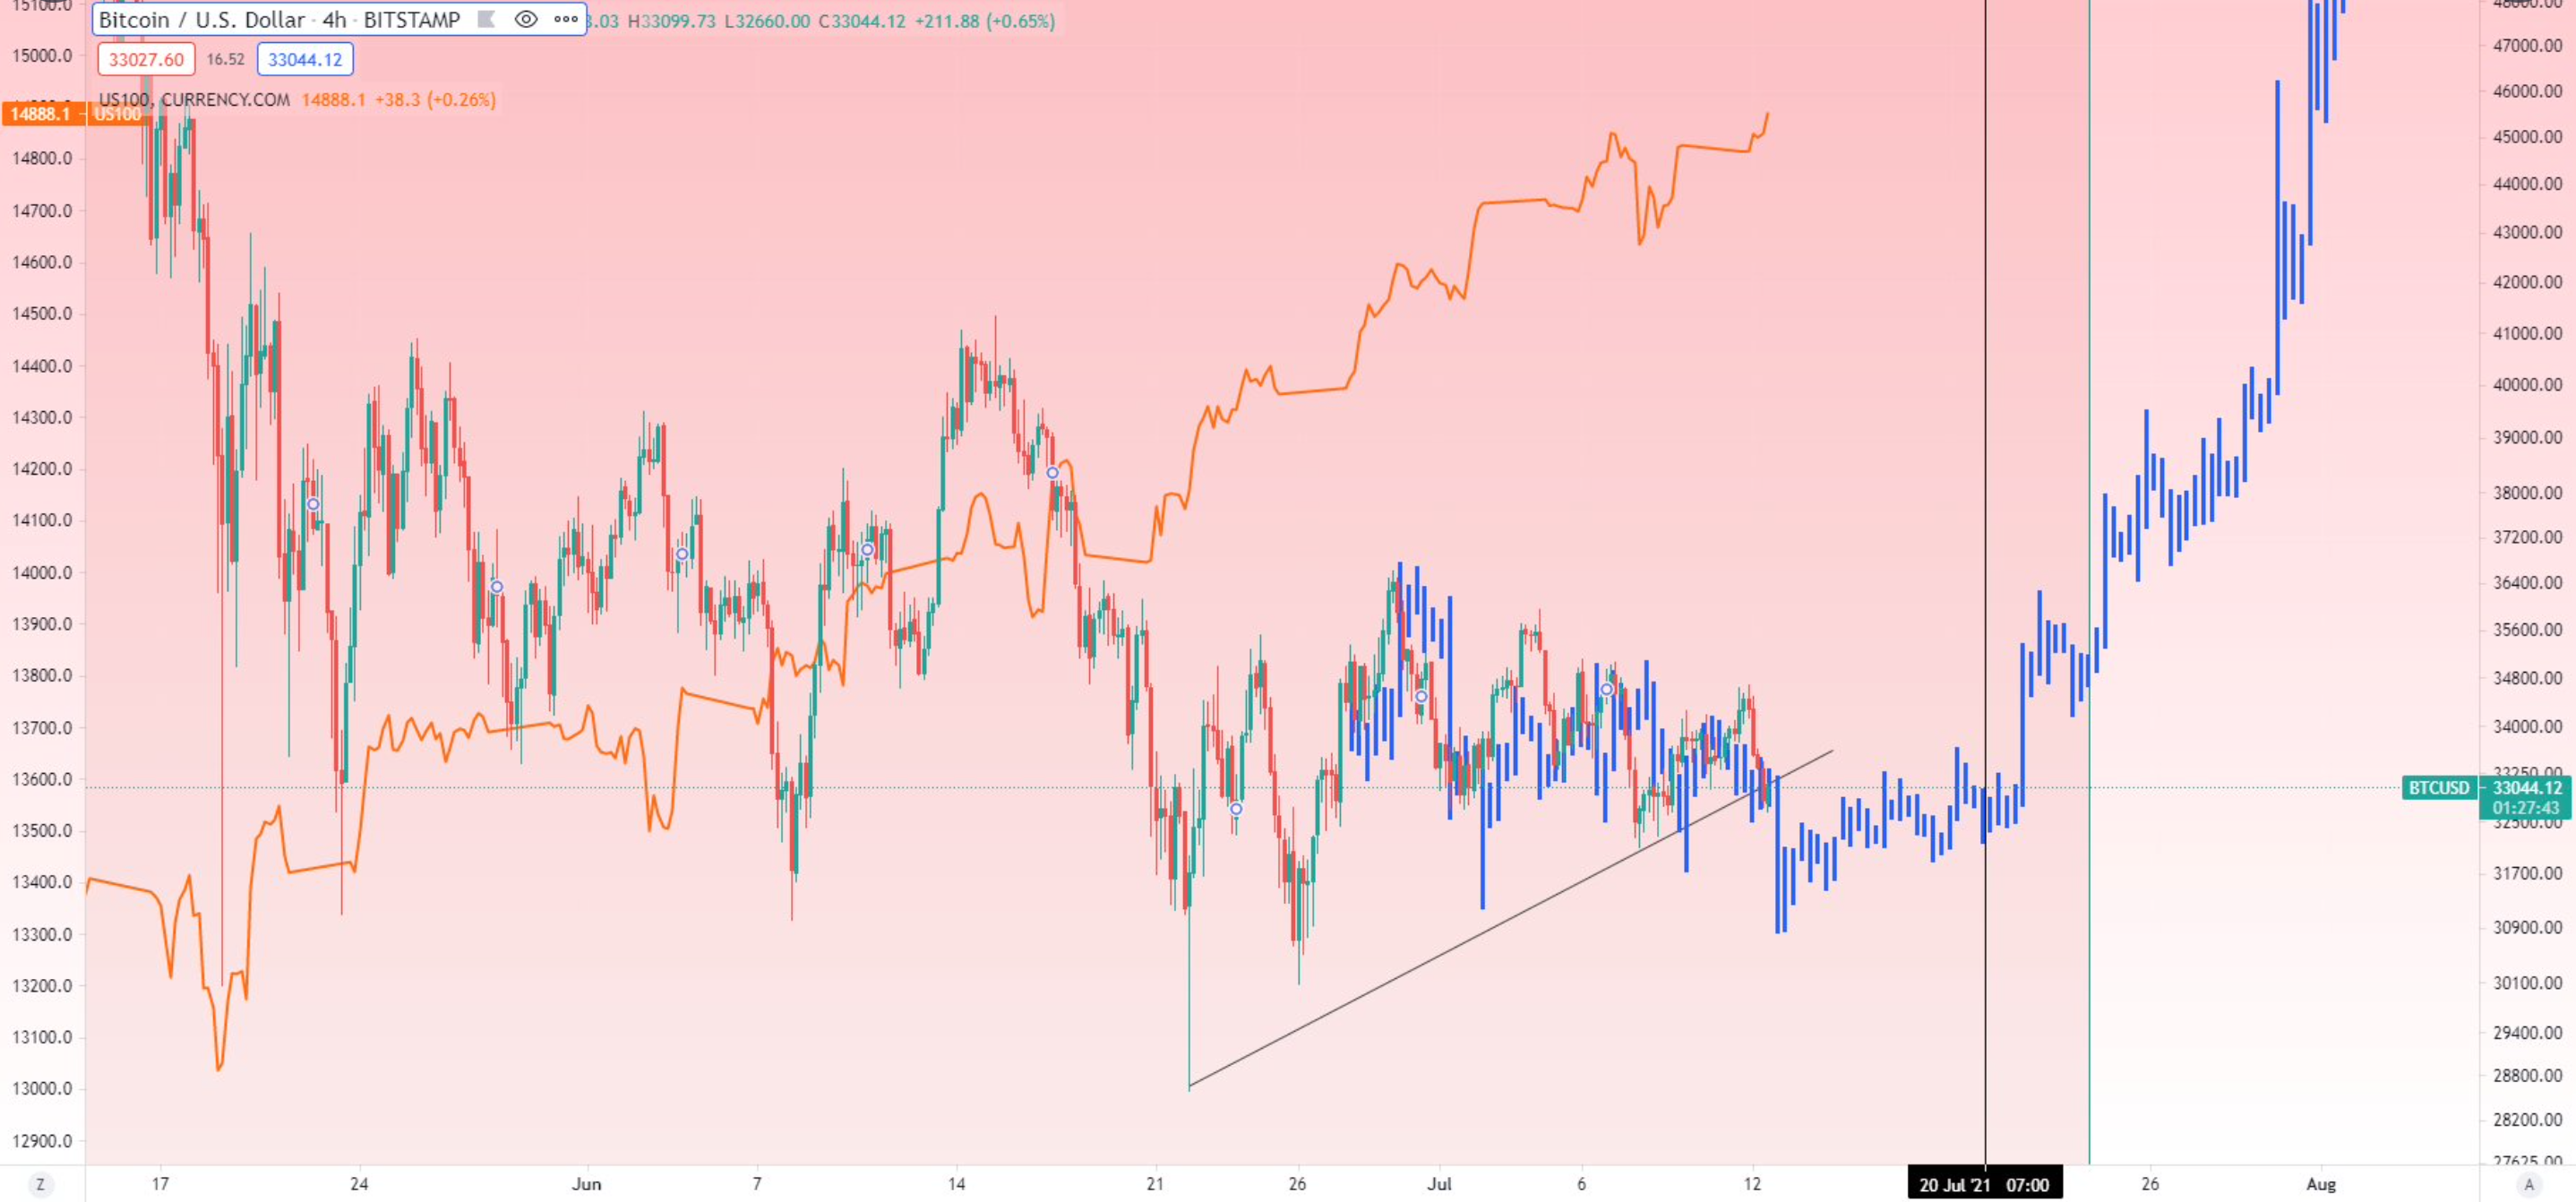
Even though the chart did look bearish, it could be looked at from the perspective of his projected July BTC price action. That is, continuing with the idea of BTC’s present rhyming with its past, the analyst hoped for a similar price recovery as portrayed last year, in July. As per his attached chart, Bitcoin could consolidate until the end of July, and then take off to hit the $48,000 mark by August.
Presenting a similar viewpoint, of considering past analysis or observations to look at the currently growing uncertainty, Santiment provided the following data,
📊 #Twitter's sentiment toward #Bitcoin remains negative in the amount of volume and tone that our algorithm is picking up. Generally, when there is negativity, there is a higher degree of a price upswing to catch the crowd off guard. 😎 https://t.co/ARclipKefs pic.twitter.com/CVEzj2TNSD
— Santiment (@santimentfeed) July 16, 2021
As per the above chart, Bitcoin tends to perform in the opposite direction of the general sentiment. Consider this, the crowd was mainly optimistic in early January when BTC had reached a new all-time high, but it quickly backtracked. On the contrary, once the community sided with the bears, bitcoin went on an impressive run to eventually record an ATH.
At the time of writing, BTC was trading just below the $31,700 mark with a surge of about 1.5% in 24 hours.