Bitcoin: How can market participants navigate this ‘higher highs’ phase

After consolidating in the $46k-$49k bracket over the past week, Bitcoin’s price finally broke above $50,000 recently. Now, the king coin’s price action has undoubtedly given the bulls a reason to rejoice. However, should traders and investors be celebrating too early? Well, until the trend confirms itself, it is best to remain extra cautious.
Are we looking at a dead cat bounce?
The aforementioned recovery has evidently stirred a fair share of optimism among market participants. However, at this stage, it should be noted that Bitcoin is still below its $51k resistance level. What’s more, in retrospect, a handful of critics have suggested that the ongoing surge is merely a dead cat bounce.
A dead cat bounce is considered to be a continuation pattern. Here, at first, the bounce may appear to be a reversal of the prevailing trend but it is quickly followed by a continuation of the downward price action. Right now, however, the odds of such a situation unfolding look fairly unlikely, primarily because of a couple of reasons.
One, Bitcoin has been trading above all its moving averages, right from the 20 and 50-day to the 100 and 200-day. This reasonably projects a bullish confirmation. Usually, a retracement from these levels invalidates the optimistic narrative and paves the way to hikes becoming dead cat bounces.
Further, the current state of a host of other indicators too supported the same narrative.
So, is the market heading towards another top?
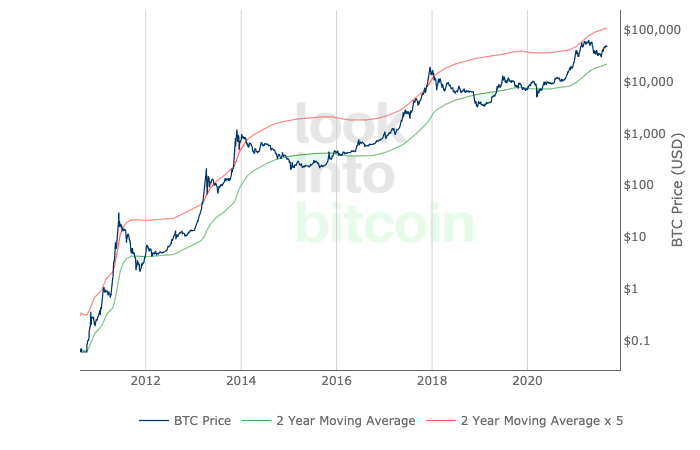
In short, yes. Well, every bull run to date has concluded with the 2-year moving average multiplier remaining above or at least touching the red line. That being said, it should also be noted that the same has typically hovered mid-way during the nascent phase of any bull run. At the moment, the multiplier is somewhere in between and is inching towards the same threshold.
Ergo, keeping in mind the consistent northbound movement of the multiplier, it can be projected that the prevailing price hike is unlikely to be temporary.

Source: LookIntoBitcoin
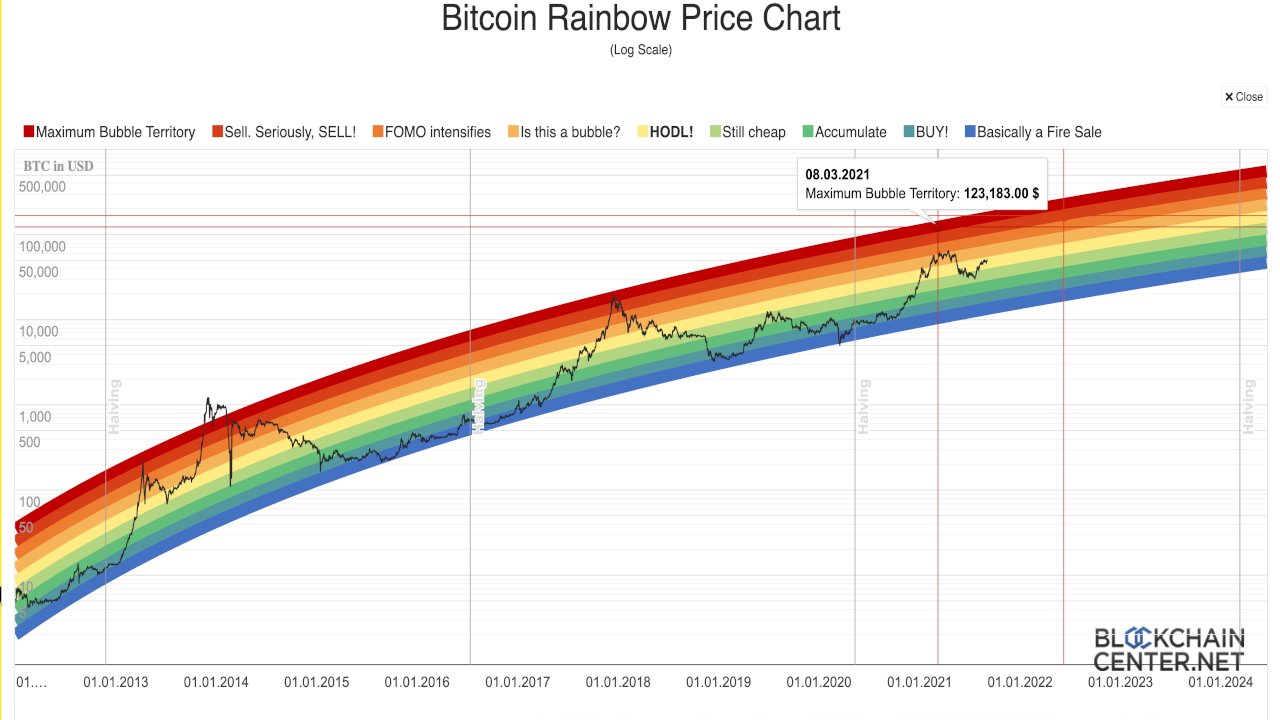
Curiously, BTC’s price on the rainbow log chart has never stepped into the sell zone even once during this cycle. As can be observed from the chart below, it did during most other cycles. Nonetheless, it is worth noting that the price has already taken a step from the ‘cheap’ to ‘HODL’ zone and is on the verge of breaking into the ‘bubble’ zone.
Every time a similar scenario has unfolded in the past, BTC’s price has made it to the red zone. Hence, expecting something similar this time around too makes sense.

Source: blockchaincentre.net
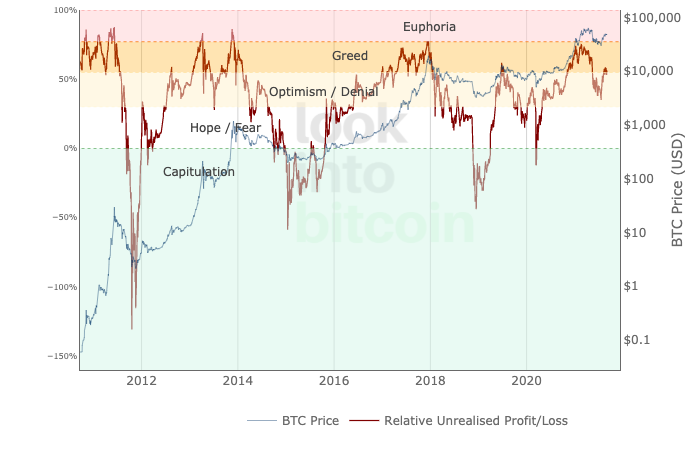
Further, the net unrealized profit and loss is another key indicator that helps in affirming the direction of any ongoing trend. As can be seen from the chart attached, all the previous market tops have been marked with a cross into the ‘euphoria’ zone. As far as the current state of this indicator is concerned, the NUPL has stepped into the greed zone already from the denial/optimism zone. In fact, it is heading towards the top.
This projection too, by and large, highlights that Bitcoin’s price is heading towards a new top and would improbably give up before that.

Source: LookIntoBitcoin
Conclusion
Bitcoin has been around for a long time. Drawing conclusions from its historical records have, more often than not, hit the nail on the head. However, the market can end up acting irrationally as per its own whims and fancies.
It, therefore, is essential for market participants to evaluate entry-exit points and have an escape plan ready. Looking at the way things have played out in the past, this bullish phase is likely to stay until November.


