Bitcoin investors have every reason to maintain caution and this is why

Bitcoin’s [BTC] much-awaited journey to $30,000 was met with some resistance as the king of cryptocurrencies traded at $27,997 at press time. BTC dropped by 0.59% in the last 24 hours and witnessed a drop of 0.08% in the last seven days as per data from CoinMarketCap.
However, BTC’s mining difficulty moved in a different direction. As per data from the on-chain intelligence platform, Glassnode, BTC’s mining difficulty reached an all time high as of 6 April.
📈 #Bitcoin $BTC Mining Difficulty just reached an ATH of 205,676,381,712,567,997,825,024
View metric:https://t.co/uH8dpKhxJ7 pic.twitter.com/uZS5ANLMOr
— glassnode alerts (@glassnodealerts) April 6, 2023
Is your portfolio green? Check the Bitcoin Profit Calculator
In addition to the aforementioned information, BTC’s miner to exchange flow also reached a three-month low as of 6 April.
Is Bitcoin the new green?
As per additional data from the Twitter handle glassnodealerts, BTC’s adjusted Output Profit Ration (aSOPR) crossed 1. This implied that investors held a profitable position at the time of writing. However, in the absence of a bullish trend this could also mean a market top for the king coin.
📉 #Bitcoin $BTC aSOPR (1d MA) just crossed 1.
Before: 1.00679 -> Now: 0.99541
View metric:https://t.co/vaSMpAbAg6 pic.twitter.com/Ts9SUw9nkH
— glassnode alerts (@glassnodealerts) April 6, 2023
The data mentioned above was further backed by BaroVirutal, a research boutique at CryptoQuant. As per BaroVirtual’s analysis, despite BTC’s move towards a bullish stance, a short-term price correction could follow. However, in the presence of a stronger bullish sentiment in the market, the price correction could witness a delay.
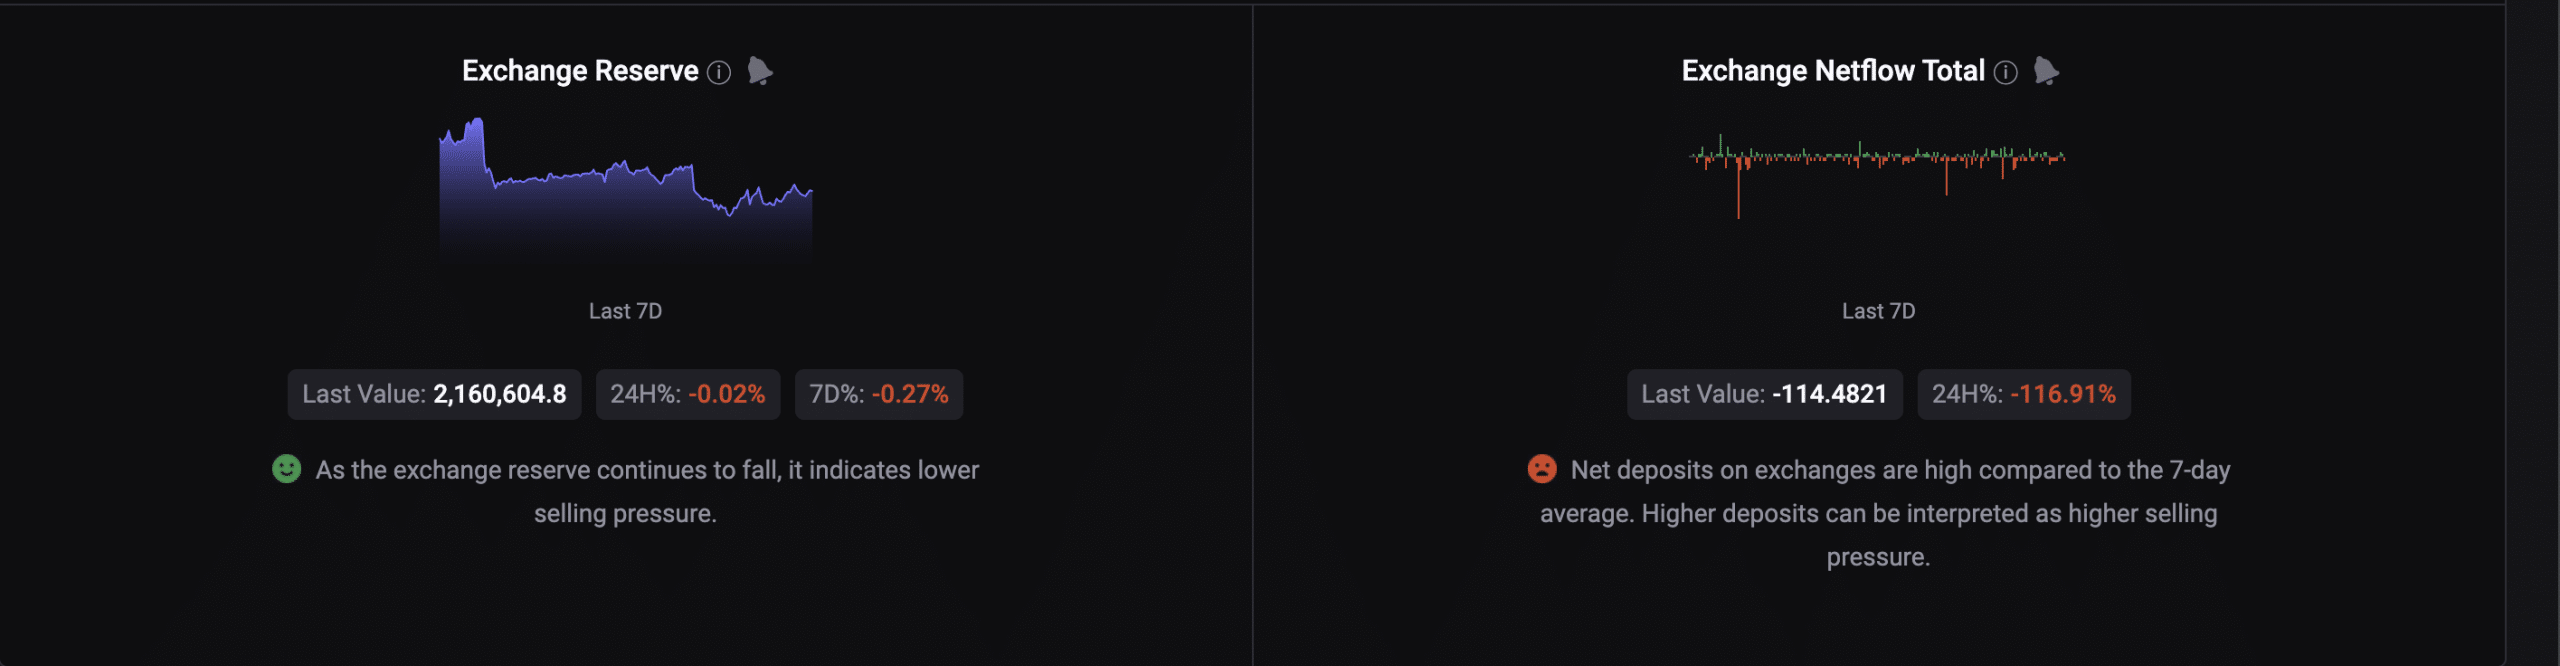
Furthermore, as per data from CryptoQuant, BTC’s exchange reserve witnessed a gradual fall over the last seven days. This could be taken as an indication of lower selling pressure in the market. However, BTC’s exchange netflow couldn’t be considered in a good spot. This was because net deposits surpassed the net withdrawals, pointing towards chances of a higher selling pressure in the days to come.
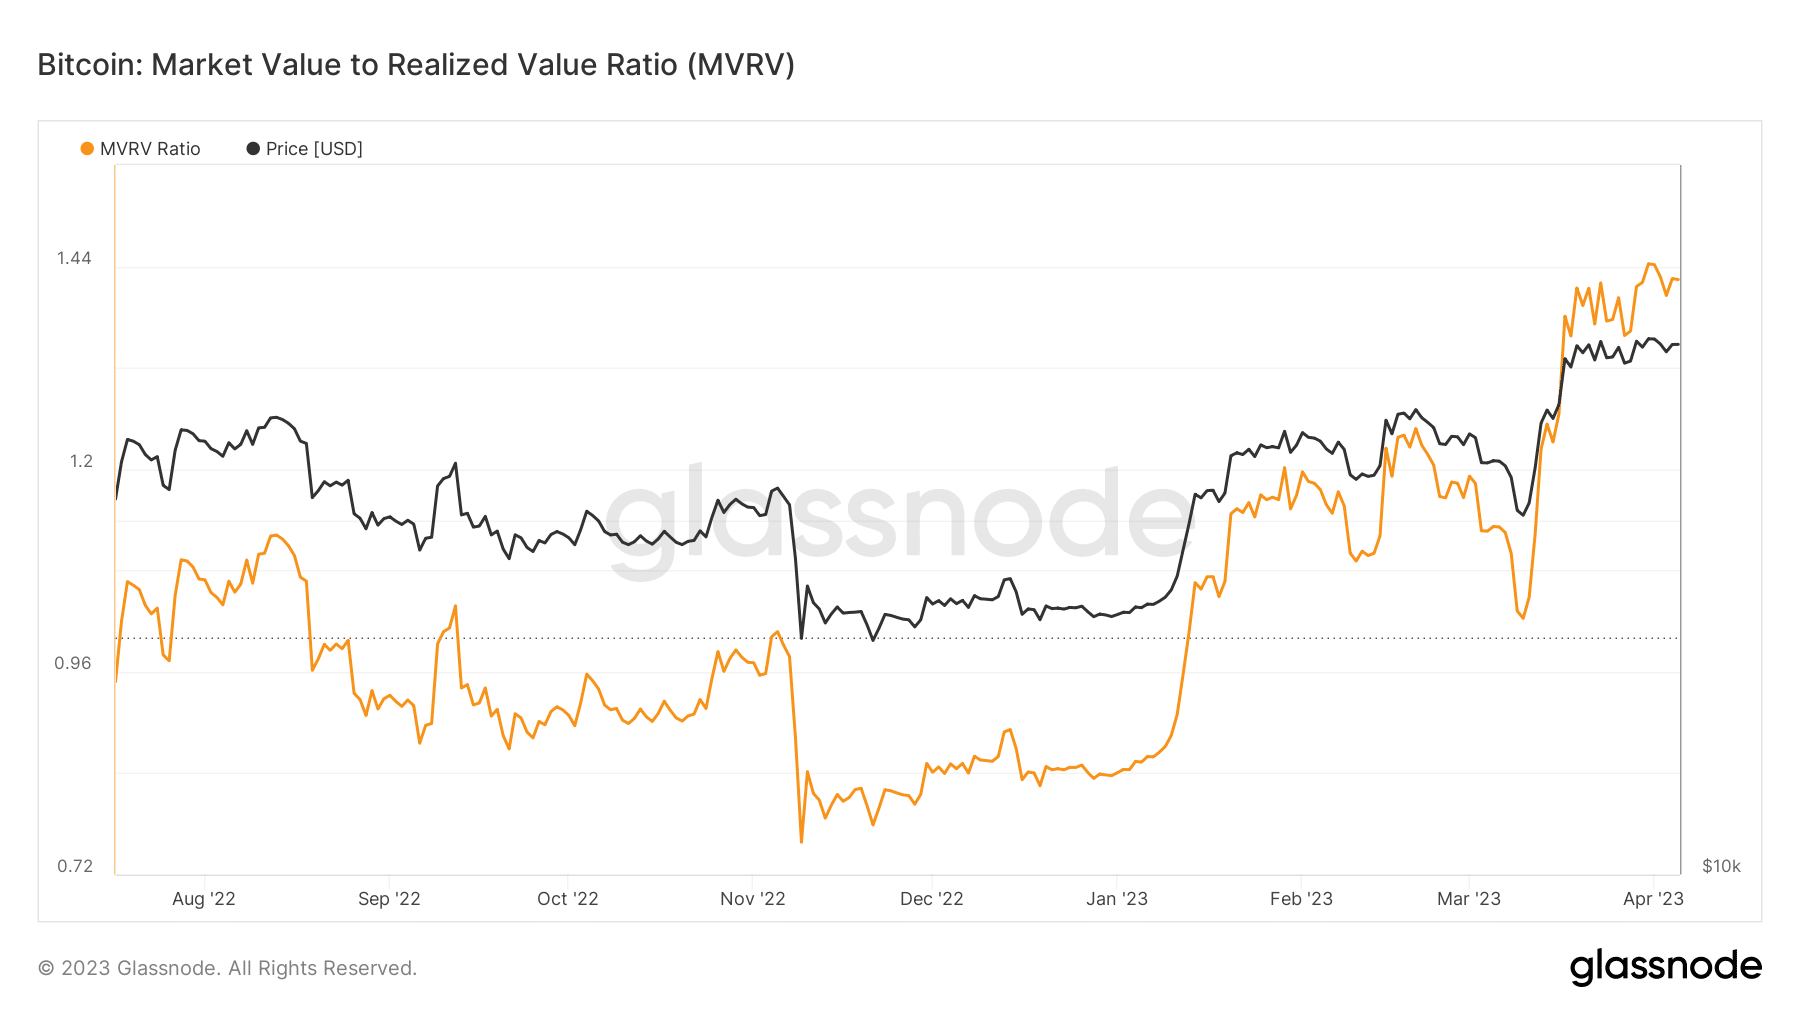
At press time, BTC’s Market Value to Realized Value (MVRV) hovered around the 1.42 area since 5 April. The absence of a clear increasing or decreasing trend could mean that the market could move either way over the next few days.
How much are 1,10,100 BTCs worth today?
It’s all in these mixed signals
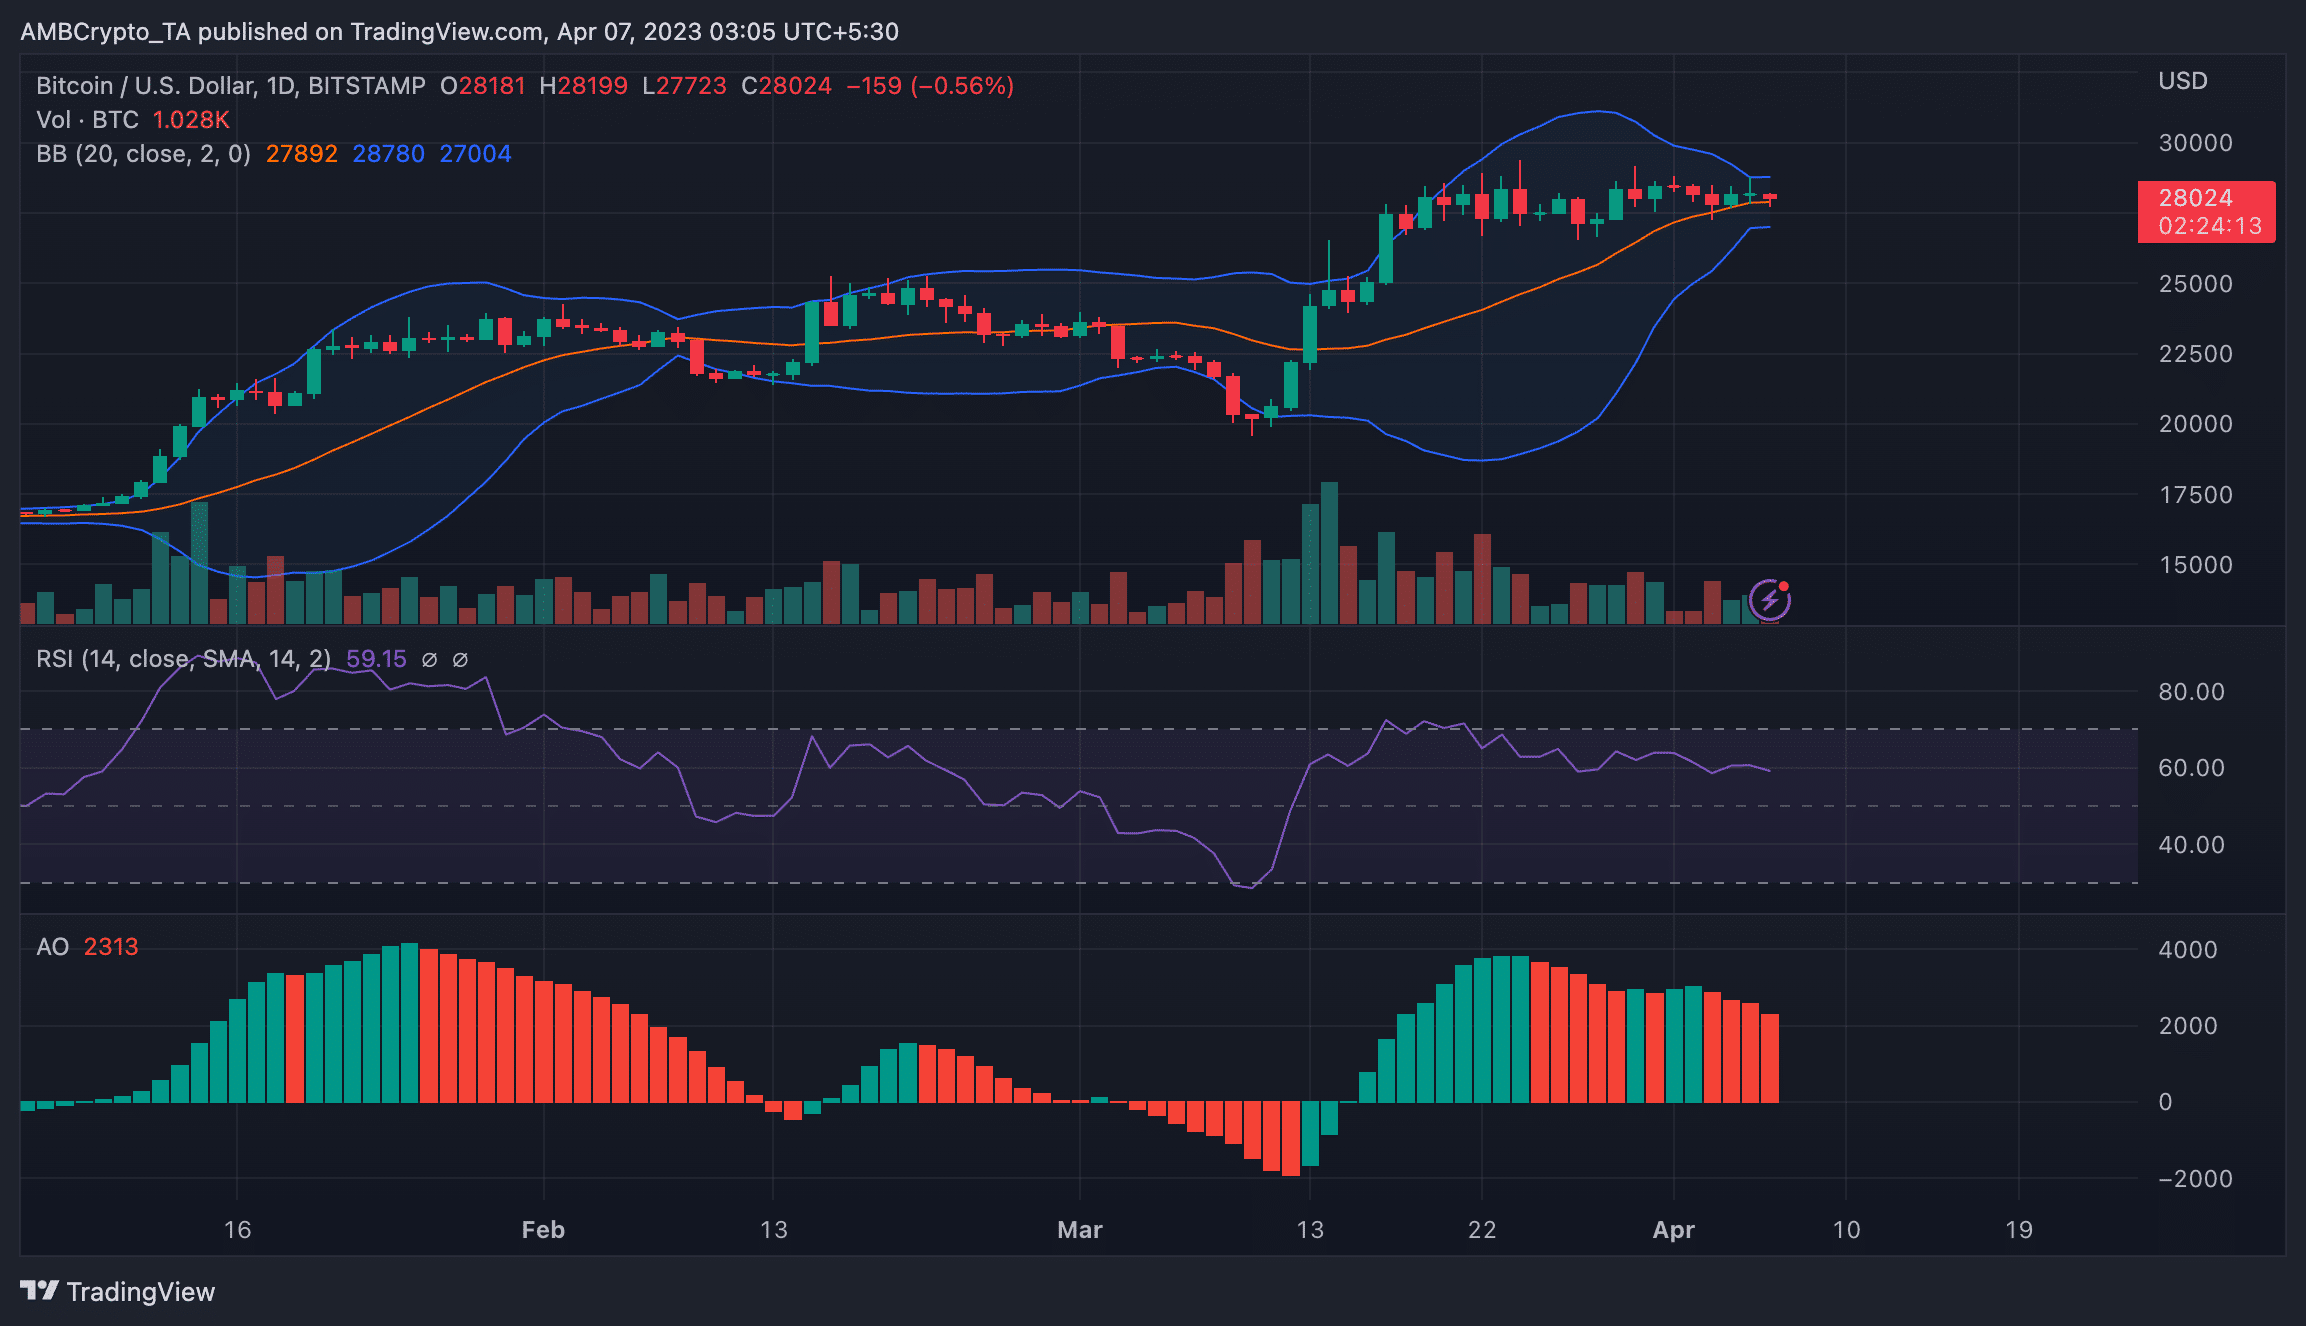
If all the above-mentioned signals weren’t confusing enough, at the time of writing, BTC’s Relative Strength Index (RSI) didn’t seem to be moving in a clear upward or downward direction. Instead, the RSI moved sideways and made its stance slightly above the 50 mark at 59.
Additionally, the Awesome Oscillator (AO) stayed above the zero line, however, flashing red bars. This could be taken as a sign of a probable price correction on the charts. Furthermore, the Bollinger Bands, at press time, were seen moving in a contracted state after what can be seen as an expansion.
So which way would BTC swing? It only seems to be a matter of time. Meanwhile, investors hoping for a clear buy or sell signal must stay cautious.