
- BTC mid-term holders are buying more coins.
- However, price may trend within a narrow range before witnessing any significant rally.
The Bitcoin [BTC] market is witnessing a trend of accumulation by the coin’s medium-term holders, as noted by the pseudonymous CryptoQuant analyst SignalQuant in a recent report.
Medium-term holders are those who have held their assets for a period between six months and seven years.
According to the analyst, this shift in behavior amongst this cohort of BTC holders, as its price continues to face resistance at the $70,000 price level, suggests a growing confidence. It signals that they prefer to hold onto their assets rather than sell them.
BTC to trend in a tight range?
Assessing the coin’s historical performance, SignalQuant found that in the third quarter of 2019, when a similar accumulation pattern was observed among BTC’s mid-term holders, its price moved sideways for over six months before eventually experiencing a rally.
One may argue that this historical context provides a potential parallel for the current market conditions.
It hints at the possibility of a similar prolonged sideways movement before a significant uptrend is witnessed.
An assessment of BTC’s key technical indicators on a 1-day chart confirmed that the price consolidation was already underway.
For example, the leading cryptocurrency traded close to its 20-day exponential moving average (EMA) at press time and has traded in this manner since 23 May.
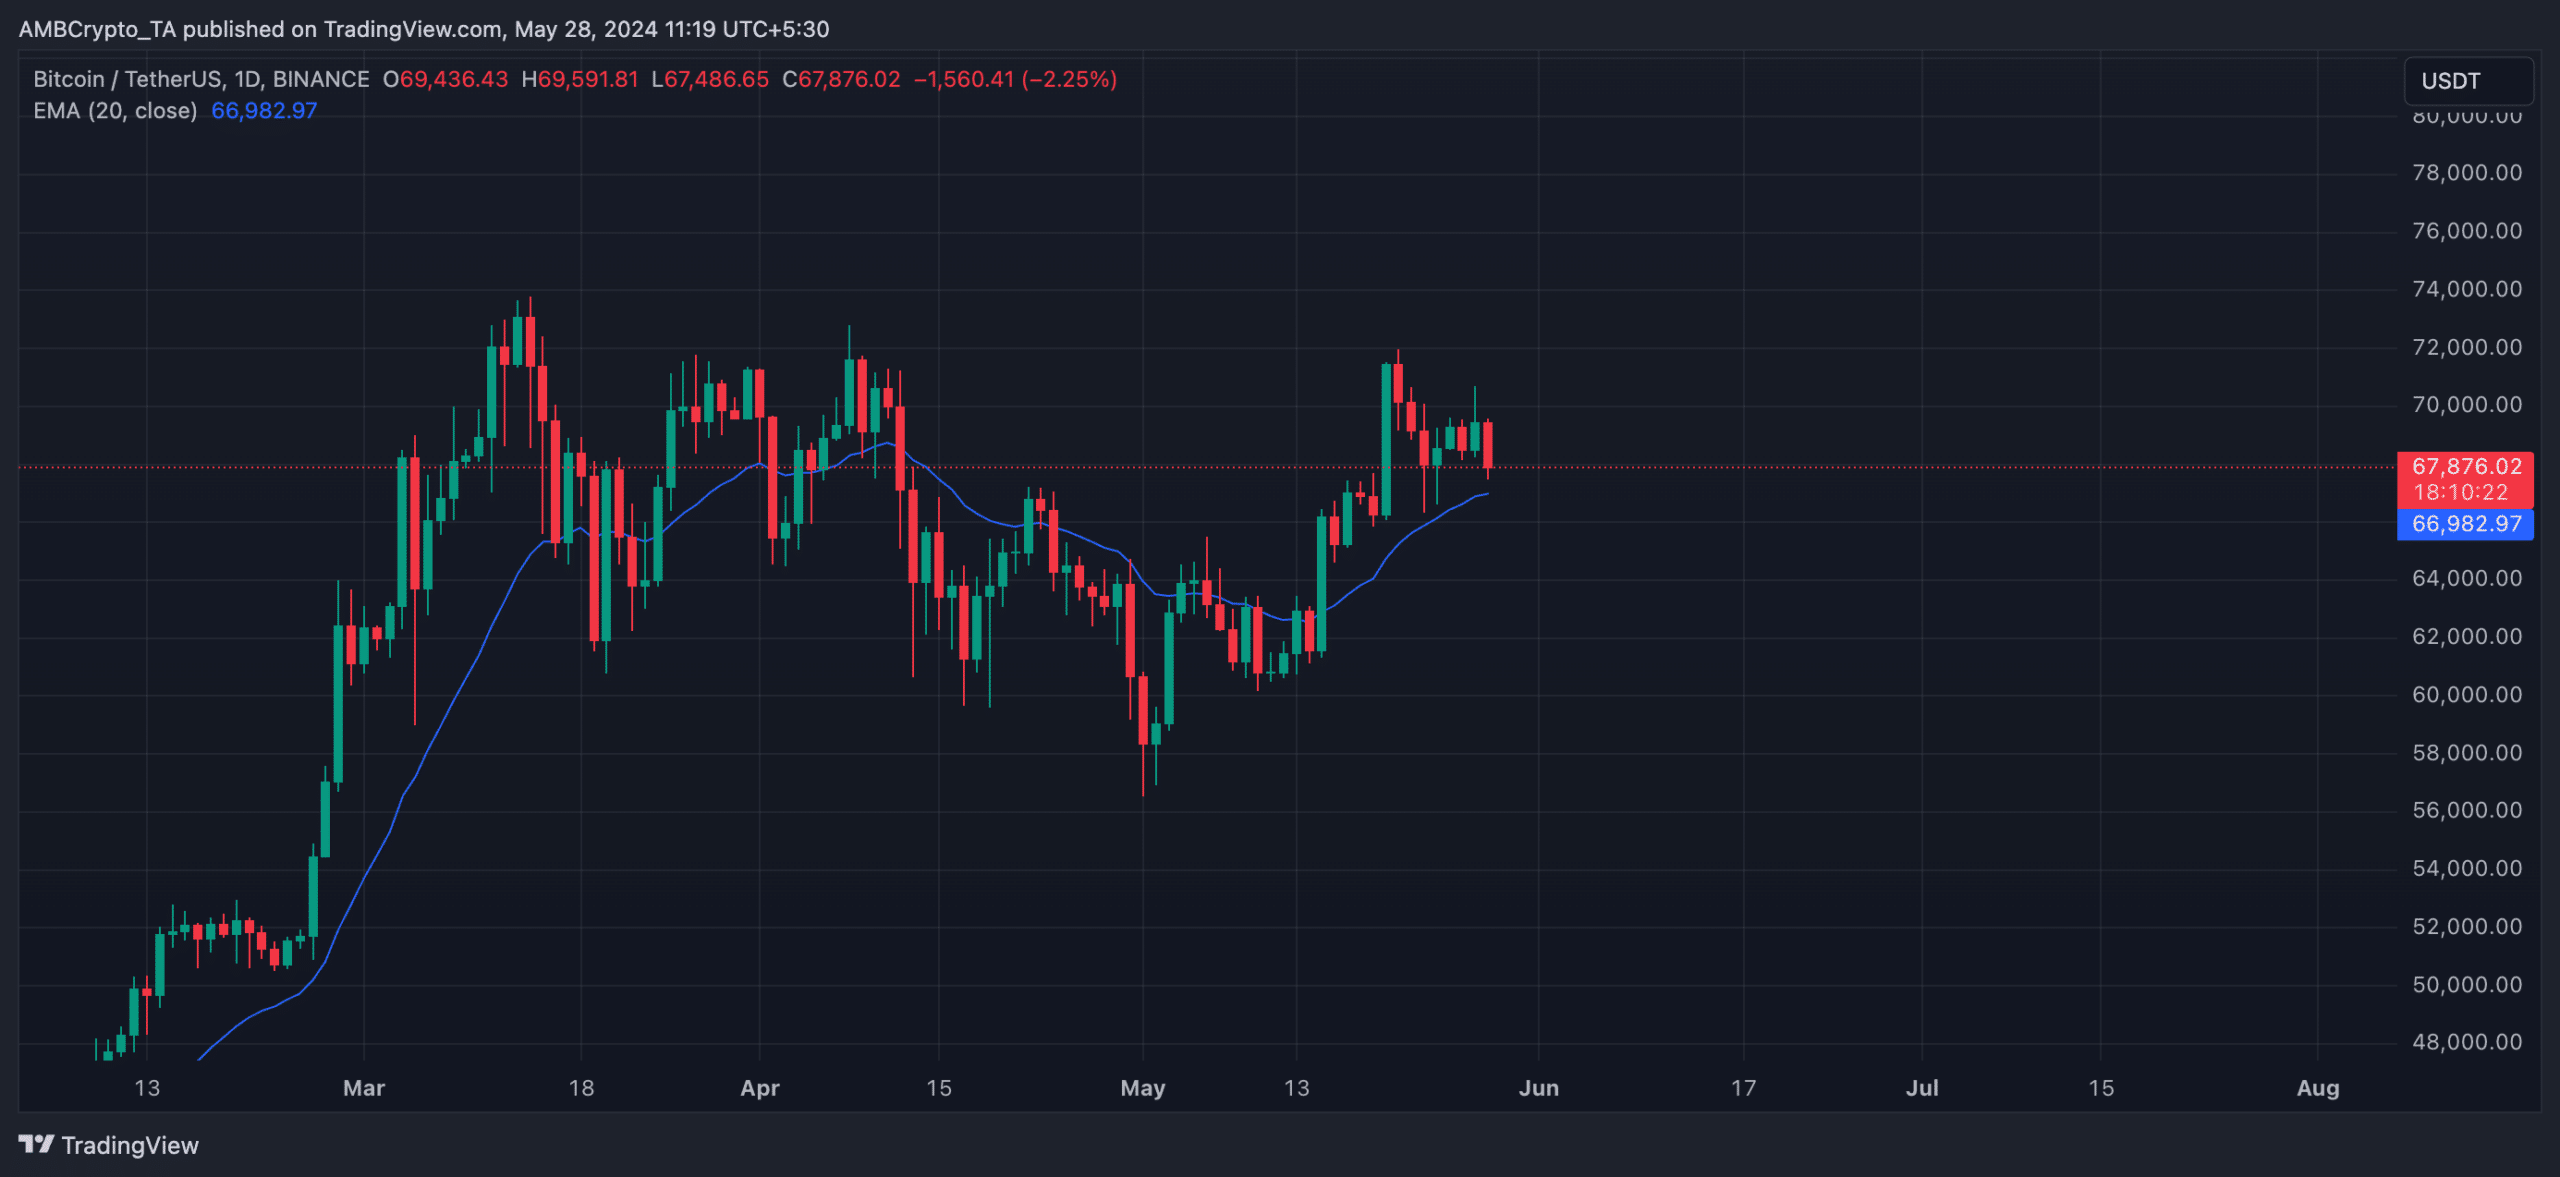
Source: BTC/USDT on TradingView
This moving average represents the coin’s average price over the past 20 days. When BTC trades above it, the coin exchanges hands above its average price in the past 20 days.
Conversely, when BTC trades under this moving average, its current price is lower than its average in the past 20 days.
When the BTC price trades close to its 20-day EMA, it suggests a period of consolidation, with neither bullish nor bearish forces dominating.
Is your portfolio green? Check out the BTC Profit Calculator
Further, BTC’s declining Average True Range (ATR) lent credence to the position above. At press time, the indicator was 2520, having declined by 21% since the beginning of May.
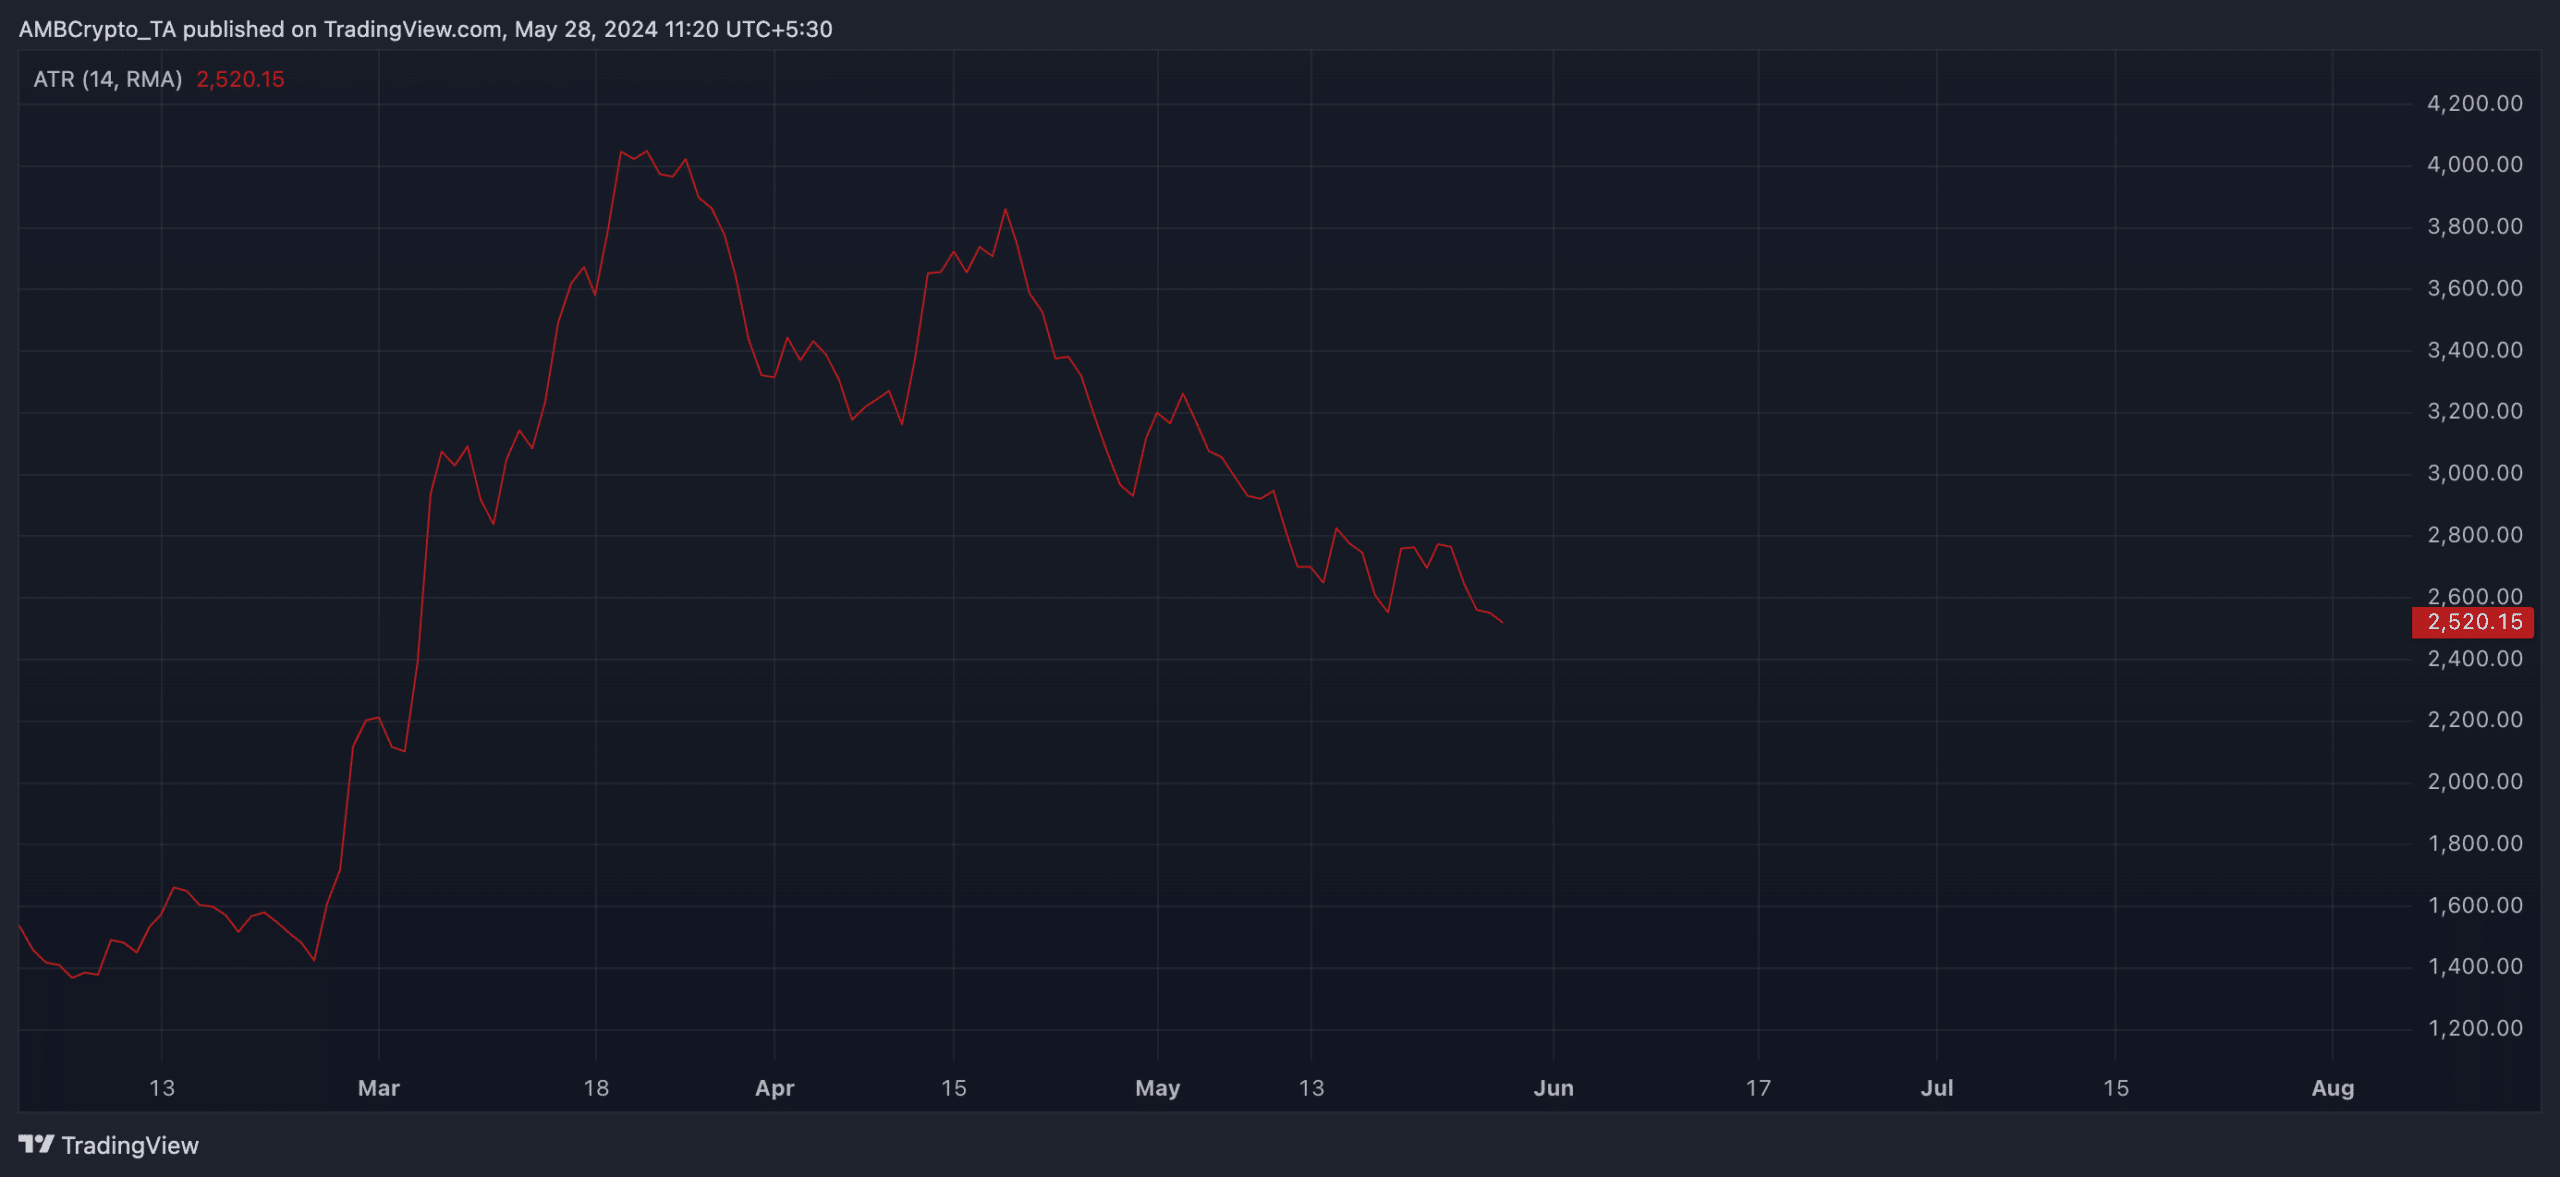
Source: BTC/USDT on TradingView
This indicator measures an asset’s price volatility. When its value drops, it suggests that the asset’s recent price movements have moved within a narrower range than the previous period.