MATIC flashes weekly buy signal: Should investors bet on it?
A daily session close above $0.75 could catalyze buying activity and usher in the volume needed to maintain the rally.

- MATIC has a bullish outlook based on the on-chain metrics, but fears of selling pressure were valid
- The range highs need to be reclaimed as support for the bulls to maintain the upward move
The TD Sequential indicator of Polygon [MATIC] on the weekly chart flashed a buy signal, observed crypto analyst Ali Martinez. This could result in an uptrend that lasts one to four weeks, he added.
Bitcoin [BTC] also showed bullish intent on Monday, the 27th of May. Continued gains for the king coin could translate to positive sentiment across the market and might aid MATIC’s rally.
The high on-chain activity might spur organic MATIC demand
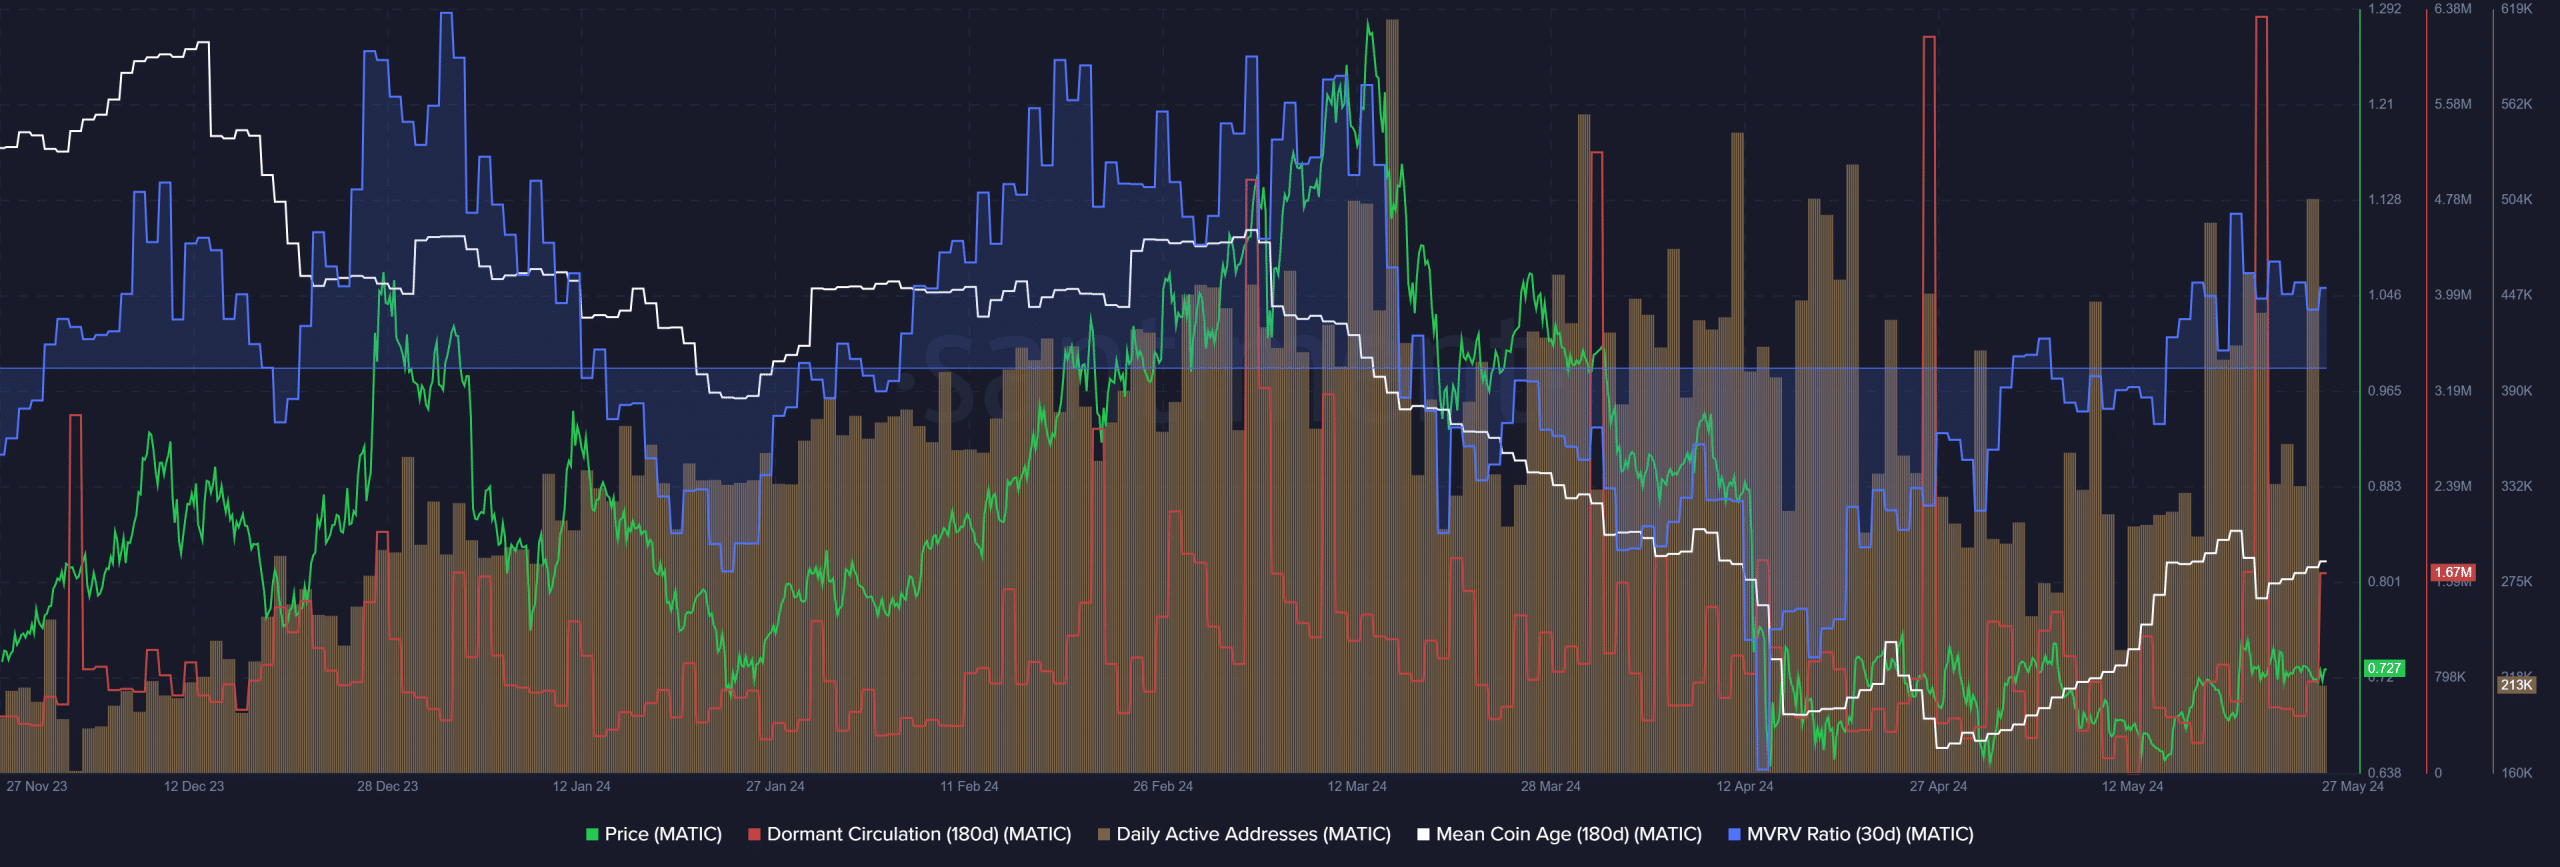
The daily active addresses peaked in mid-March and trended downward till early May. Yet the numbers hovered around the 400k-500k daily active users mark consistently despite the sharp downtick in price.
The mean coin age began to trend higher over the past month to reflect network-wide accumulation. The MVRV ratio had been deeply negative in mid-April but has picked up since then even though the price has formed a range between $0.65 and $0.75.
Hence, a breakout past the local resistance at $0.75 might lead to profit-taking from holders. The recent spike in dormant circulation also added to the fear that selling pressure might begin to rise.
Can the range-bound Polygon token take off?
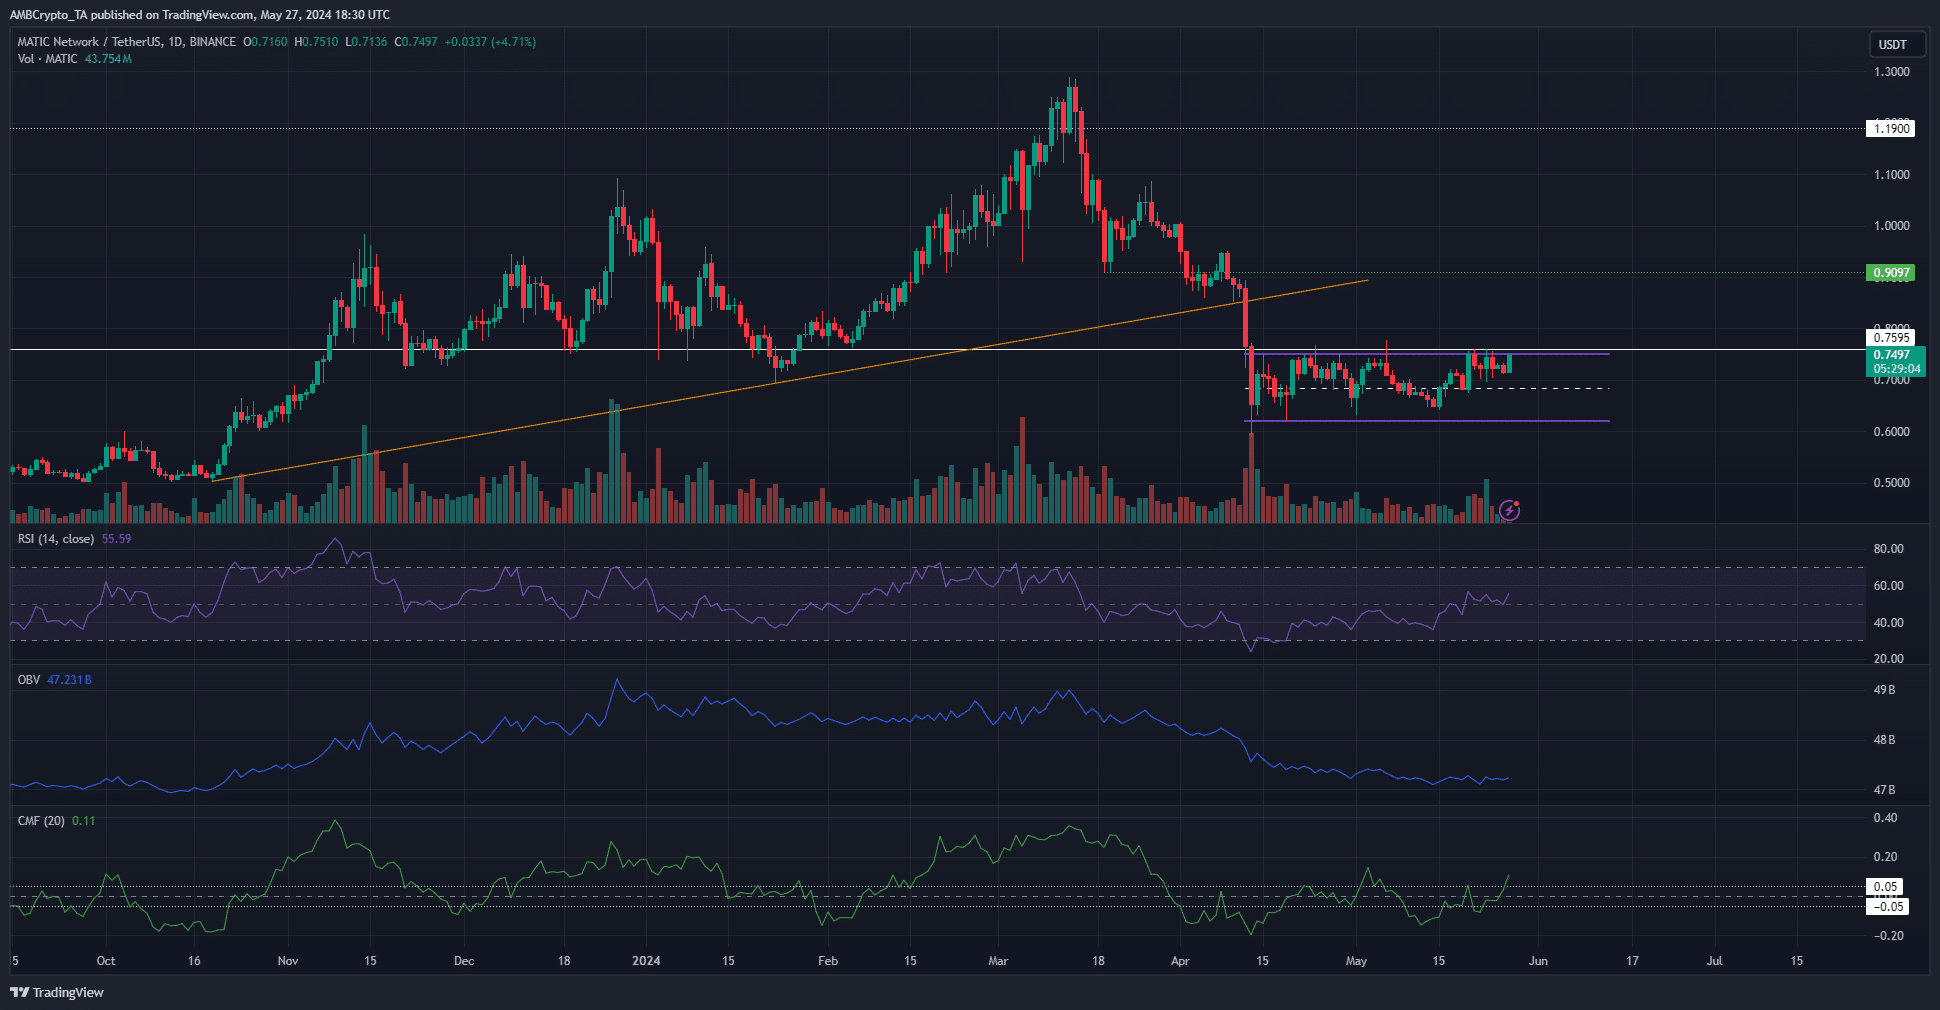
The ascending trendline (orange) failed to hold as support in April. Since then, the price has traded between a range (purple) from $0.75 to $0.65. At press time, the price was very close to breaking out past the range highs.
The RSI on the daily chart climbed above neutral 50 and flipped it to support as well. This showed bullish momentum and was also a signal of follow-through from the buyers. The CMF agreed with the bullish bias.
Its reading of +0.11 at press time indicated significant capital inflow to the MATIC market. Hence, further gains appear sustainable.
Read Polygon’s [MATIC] Price Prediction 2024-25
However, the OBV signaled the opposite of this finding. It was unable to climb out of its downtrend since mid-March. Overall, the weekly TD Sequential and the momentum indicator on the daily chart might be an early sign of a breakout.
A daily session close above $0.75 could catalyze buying activity and usher in the volume needed to maintain the rally.


