Bitcoin: Is another bull run on the horizon?
Bitcoin may experience another bull run, as a particular metric has turned positive.

- Bitcoin’s Inter-exchange Flow Pulse has trended upward in the past few weeks.
- The coin’s historical performance shows that this may be a precursor to another rally.
Bitcoin [BTC] may witness another bull run in 2024, as the recent rise in the asset’s Inter-exchange Flow Pulse (IFP) suggested the growth in bullish sentiments.
Pseudonymous CryptoQuant analyst Bullfighter inferred this in a new report.
The IFP metric is used to analyze BTC flows between spot exchanges and derivative exchanges. When the metric increases, it suggests that more BTCs are flowing into derivative exchanges.
This movement often indicates growing interest and potential for a bull run.
Conversely, when BTC’s IFP declines, it suggests that more coins are flowing out of derivative exchanges into spot exchanges. This signals a rise in negative sentiment and is usually a precursor to a potential bear run.
The analyst assessed the metric’s historical performance and found that in 2016, BTC’s IFP spent an extended period (55 days) below its 90-day moving average, indicative of a bear market.
However, by June, this metric broke above the average and trended upward, a movement that was followed by a significant rise in the coin’s price.
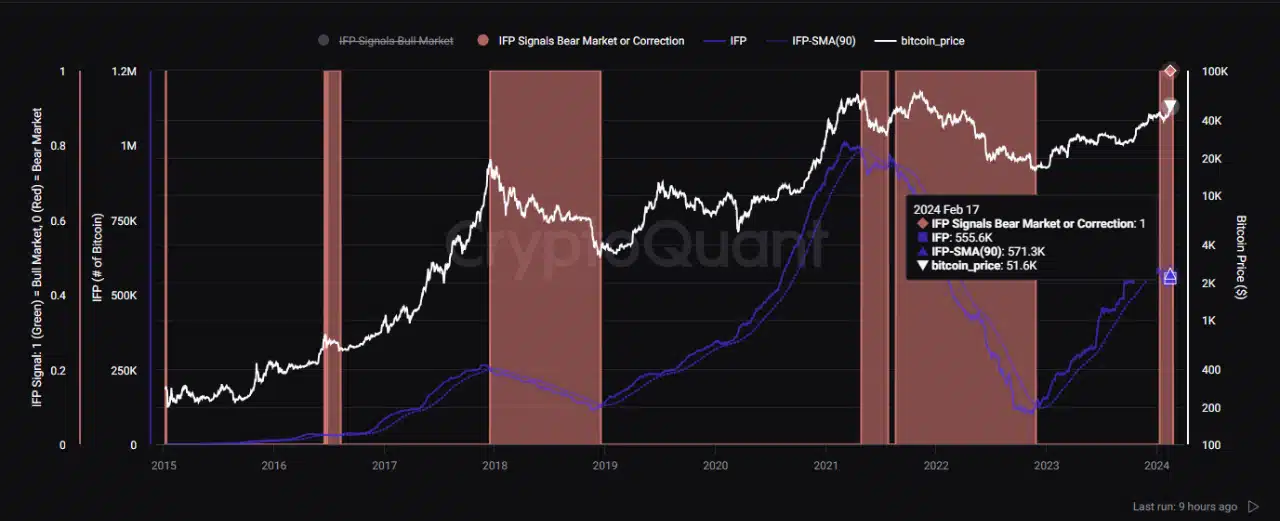
A look at the current market showed that BTC’s IFP has been trending upward since the 7th of February, after being below its 90-day moving average for 43 days.
According to Bullfighter:
“If the IFP breaks above its 90-day moving average again, we may see the bulls regain strength.”
Why you need to look both ways
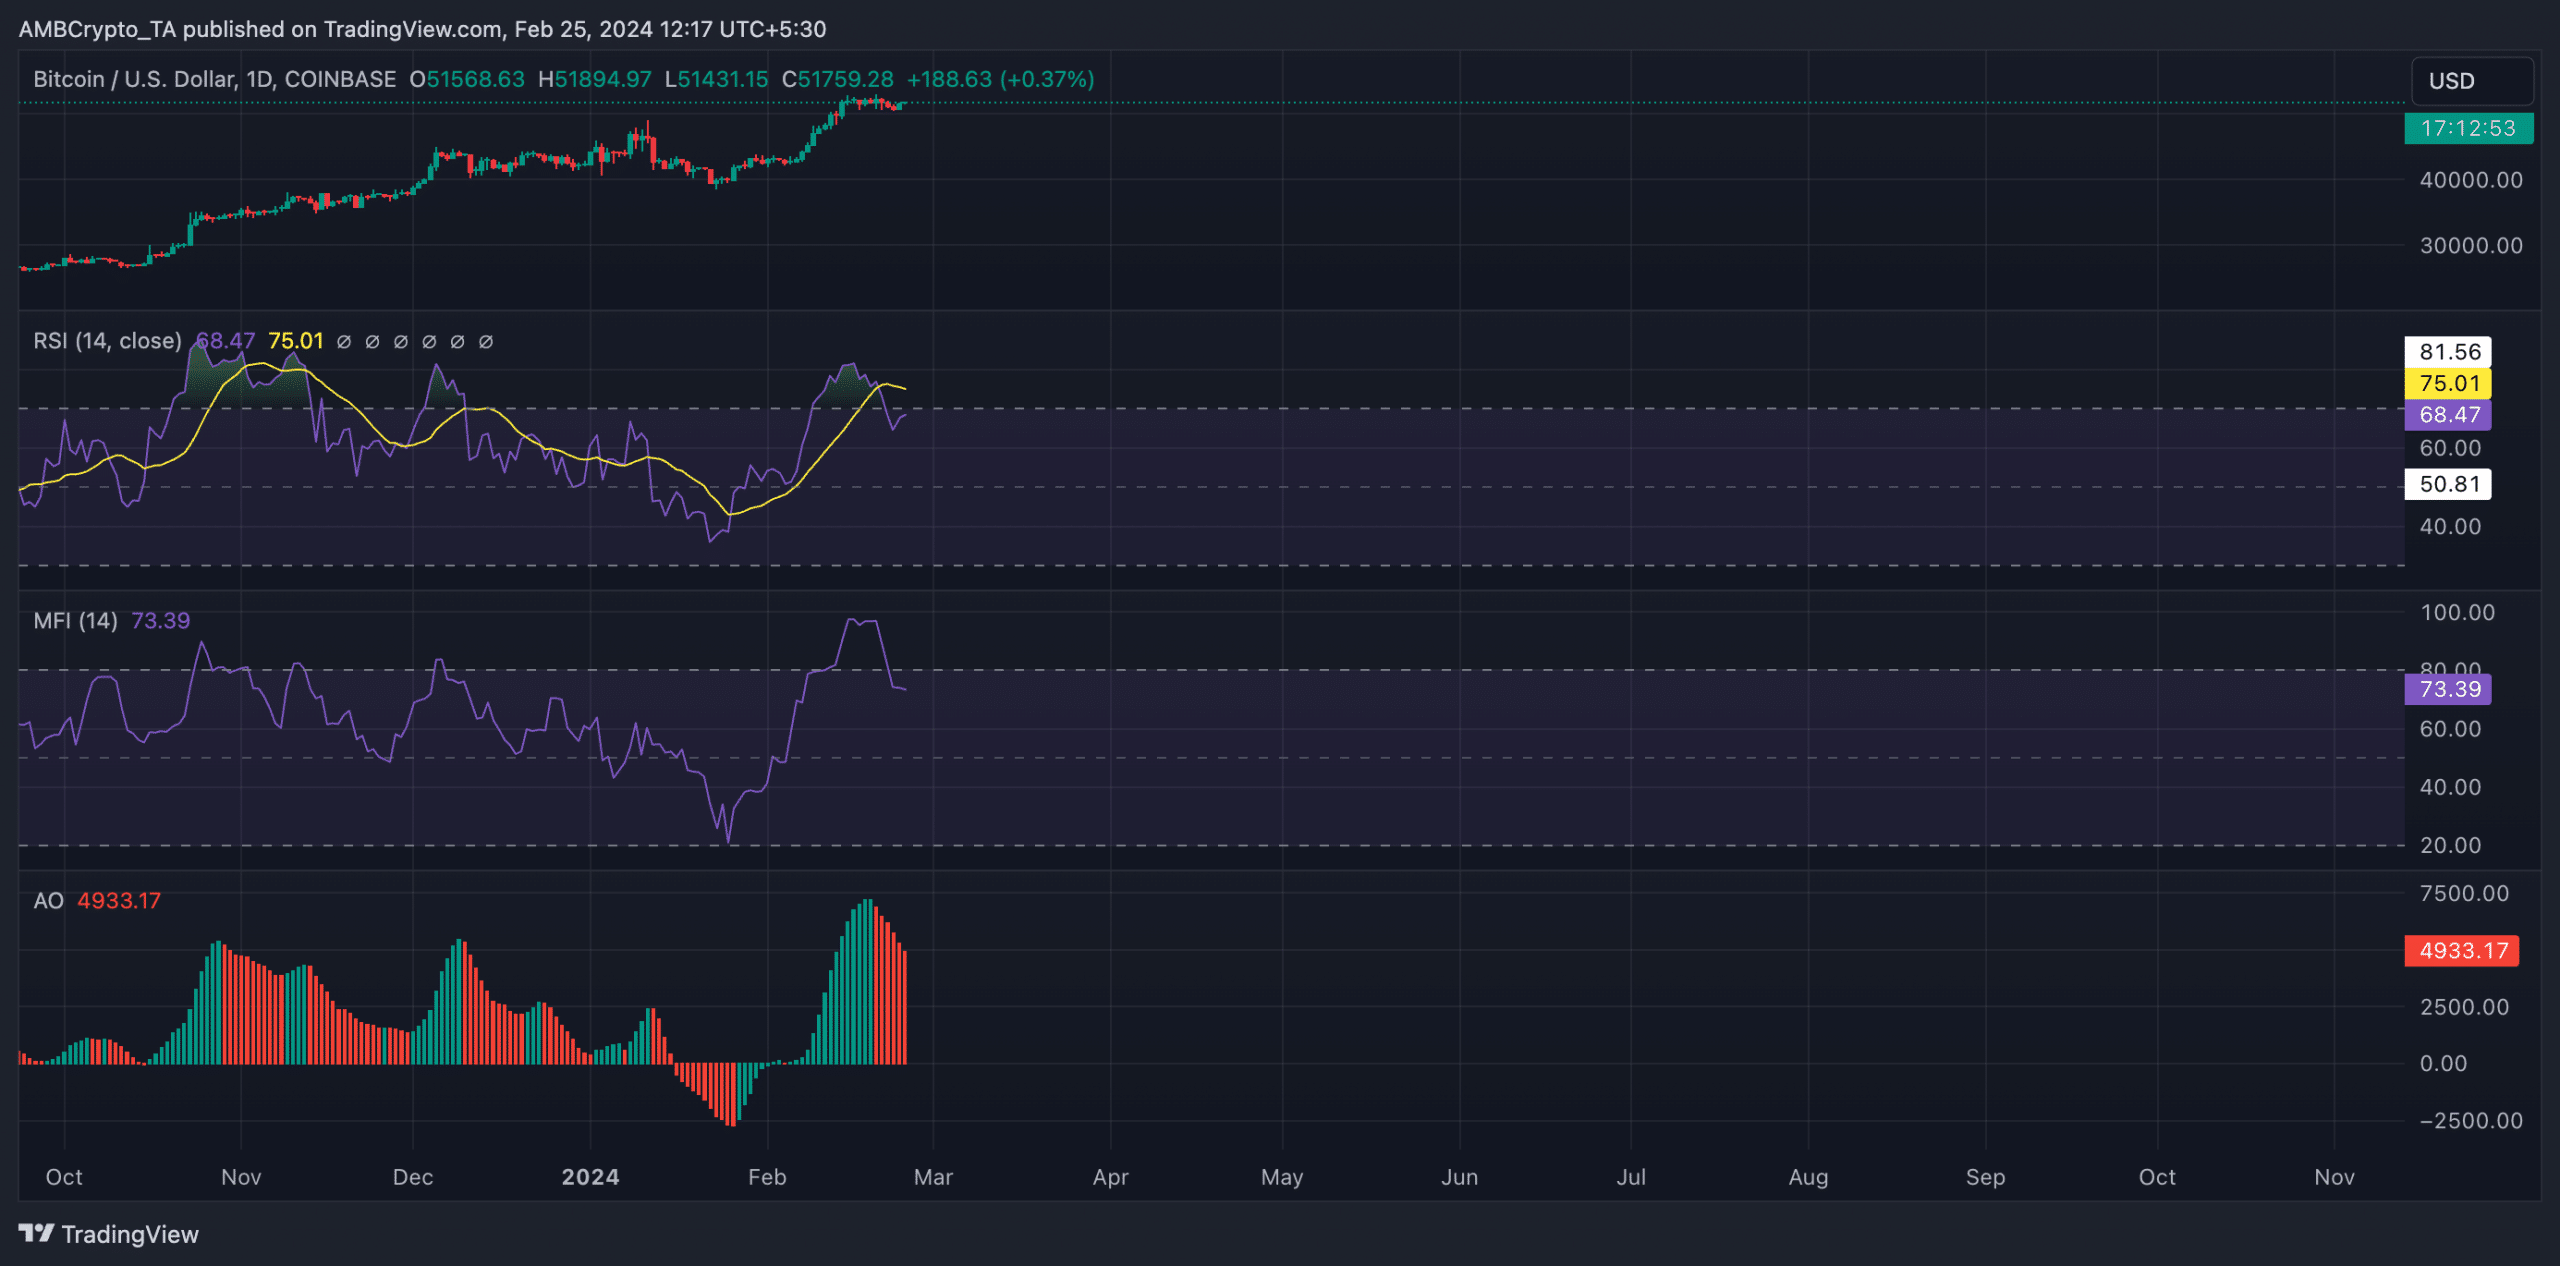
Since BTC hit the $52,899 price mark on 20th February, its value has declined. Per CoinMarketcap’s data, the coin exchanged hands at $51,658 as of this writing, dropping 2% of its price in the past four days.
An assessment of BTC’s performance on the daily chart showed that the start of the price dip four days ago coincided with when its Awesome Oscillator began to return red upward-facing histogram bars.
This indicator measures the strength and direction of an asset’s trend over a given period.
When it displays red upward-facing histogram bars, it signals the presence of bearish sentiments despite the generally bullish outlook.
Read Bitcoin’s [BTC] Price Prediction 2024-25
The slight decline in BTC’s key momentum indicators since the 20th of February lent credence to this position.
However, despite this, at press time, the coin’s Relative Strength Index (RSI) and Money Flow Index (MFI) remained above their respective center lines.