Bitcoin, Litecoin, Solana Price Analysis : 09 June

In the last 24 hours, most of the coins in the market faced losses as prices fell down extensively. Even the world’s biggest cryptocurrency could not save itself from the drop. While the 24-hour trading volume of the total market rose by 33%, Bitcoin’s market capitalization was down by 3.4%. Litecoin followed suit and faced an 18% drop in its price. However, Solana surprisingly remained unaffected by these market trends and kept its chin up throughout the week.
Bitcoin [ BTC ] :-

Source: BTC/USD – TradingView
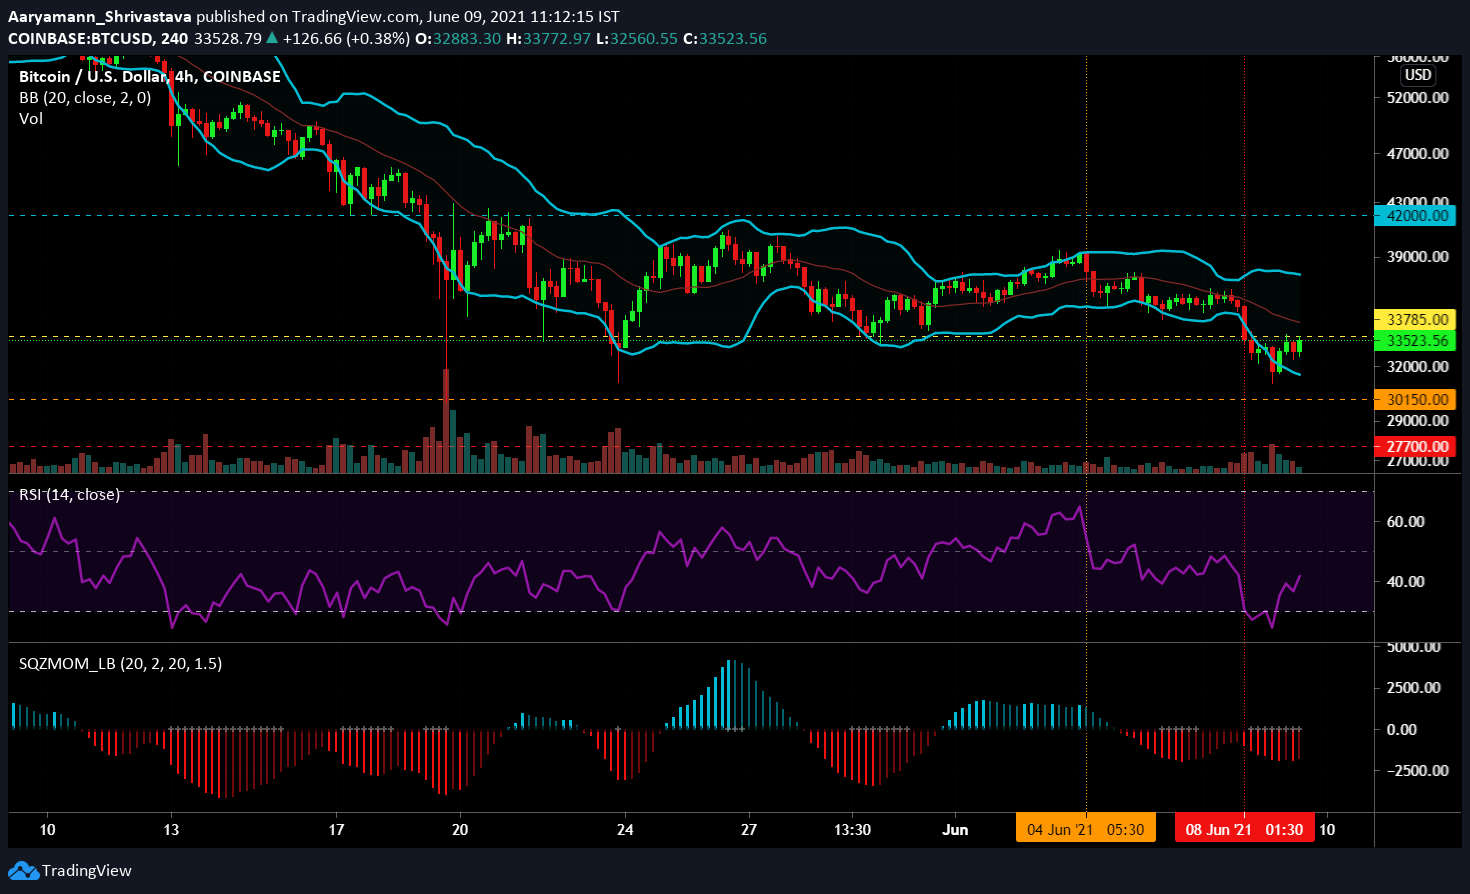
Due to the constant volatility of the market, Bitcoin HODLers have become very cautious. Between June 4 and press time the coin dropped its prices by 14.2% to trade at $33,523. Relative Strength Index continued to move in the bearish territory as well since June 4. In the last 36 hours, the purple indicator fell into the oversold region, and some buying pressure brought it back up to 43.1 at press time.
Bollinger Bands remained significantly diverged at the time of writing, indicating high active volatility. Squeeze Momentum Indicator showed that BTC had remained in a squeeze release (white dots) for the last 36 hours and at the time of writing bearish pressure could be seen receding due to the appearance of a dark red bar.
The earlier $33,785 support had become an active resistance level at press time. While this could be temporary, safer support of $30,150 must be kept in mind to ensure minimum losses should BTC fall further.
Litecoin [ LTC ] :-

Source: LTC/USD – TradingView
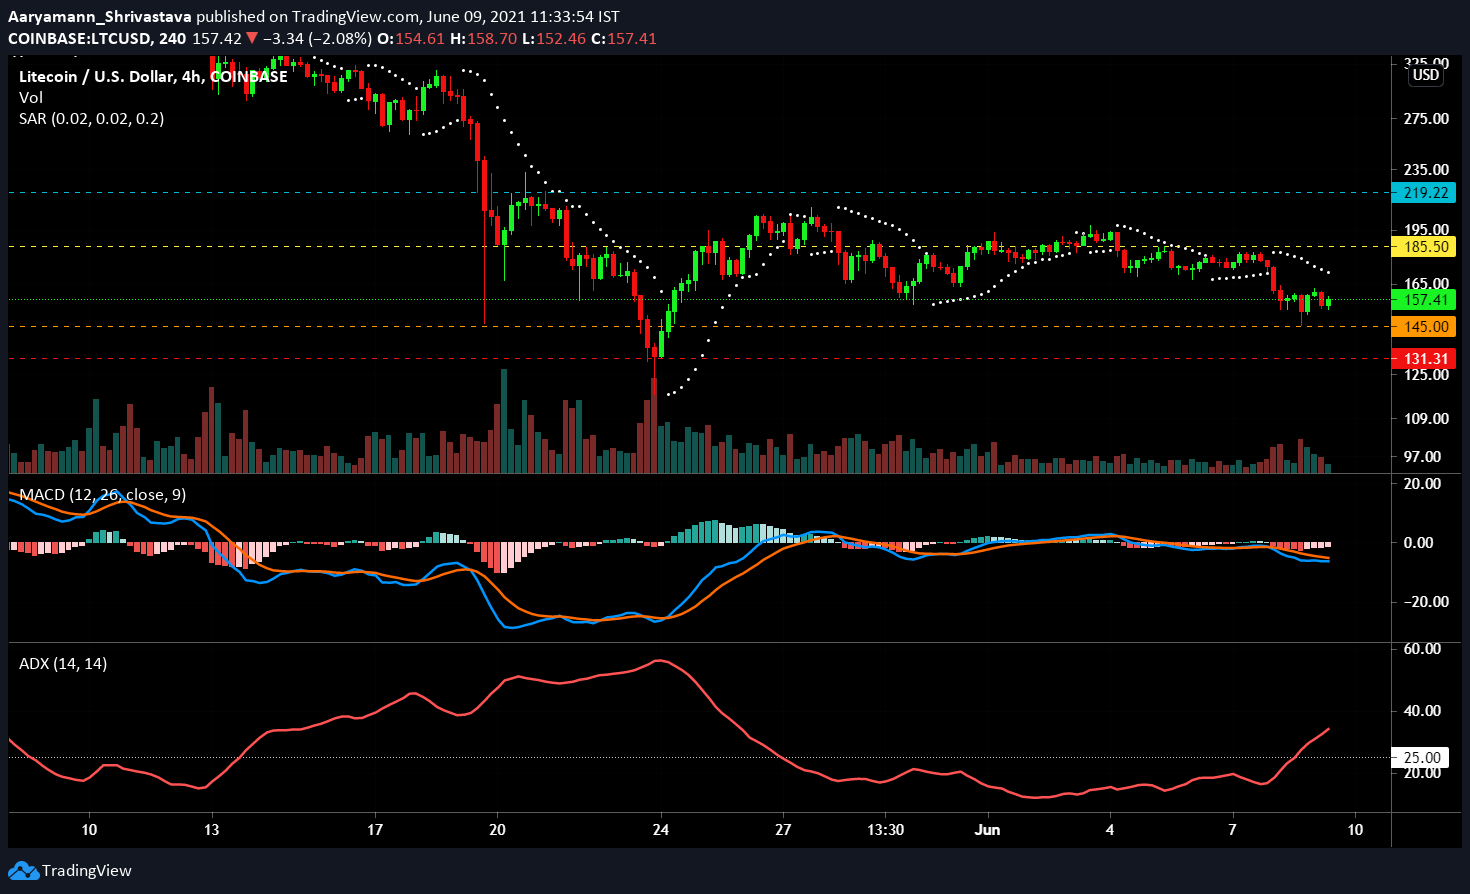
Litecoin’s movement was mostly sideways. However, LTC fell through the earlier support level of $158 and the price remained at $157.41 at press time. Due to the fairly lesser volatile movement of the coin, MACD indicator had been consolidated at the neutral line since the beginning of this month. In the last 24 hours, bearish crossover could be observed, but at the time of writing the blue indicator line and the red signal line were almost aligned.
Parabolic SAR displayed a strong downtrend in the last 48 hours. Since the white dotted line was still well above the candlesticks, this downtrend could continue for a while. This was backed by the rising Average Directional Index (ADX). The red line moved past the 25.0 mark, and its highly directional movement exhibited a stronger active downtrend at the moment.
Due to the fall in price, a temporary resistance was present at $185.50 and a new support level has been established at $145. If the prices fall further the next support will be at $131.3 level.
Solana [ SOL ] :-

Source: SOL/USD – TradingView
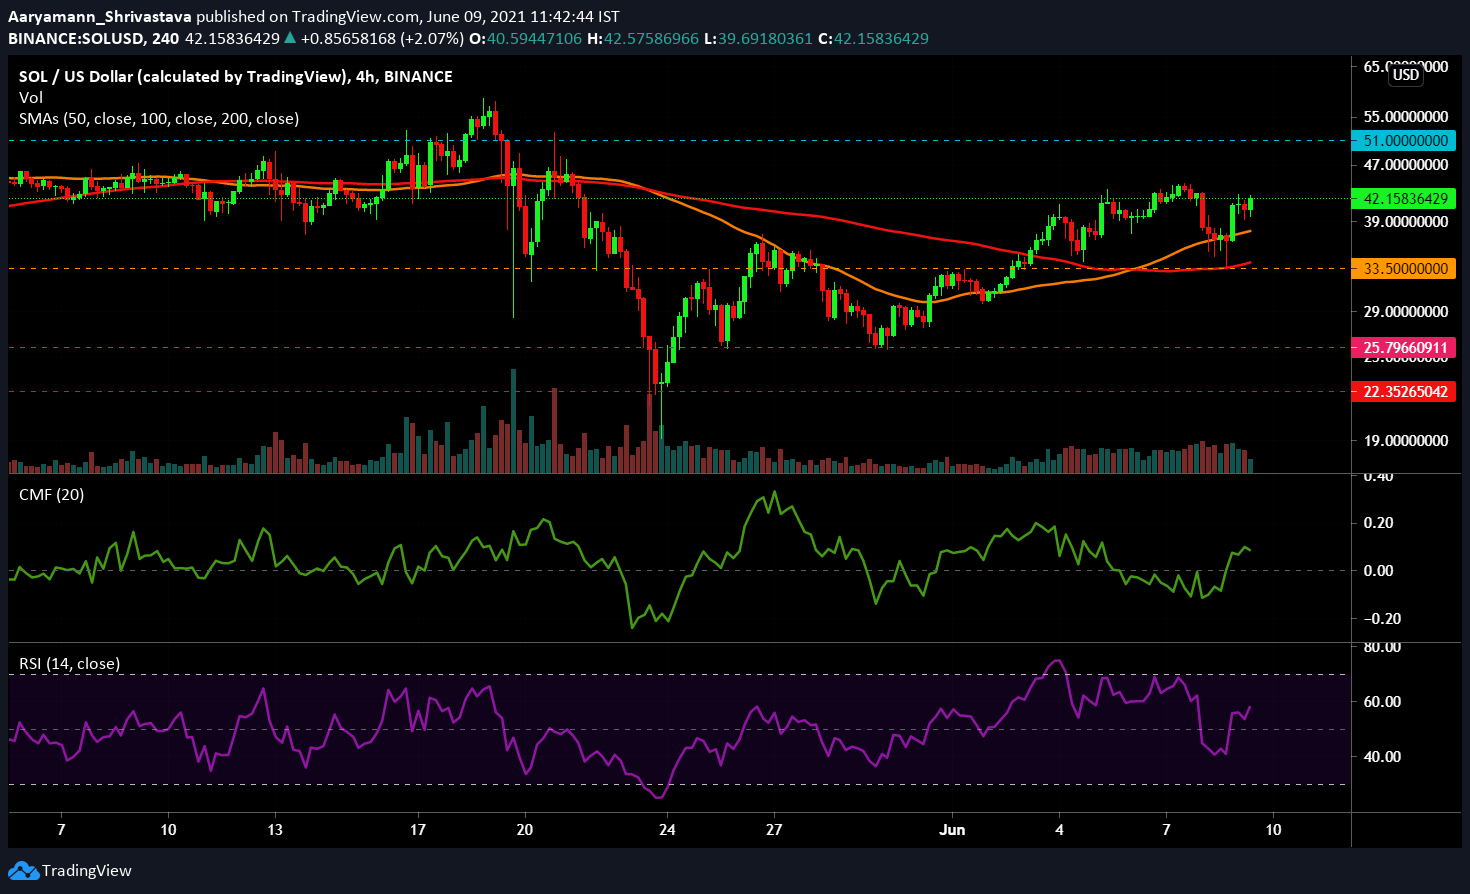
Despite SOL’s massive 14% drop on June 8, the coin made a quick recovery to trade at $42.1 at press time. However, thanks to extensive buying, the coin flipped its earlier $33.5 resistance into an active support level. This movement was triggered by the news of Solana raising $300 million to 450 million in funding to become the biggest Dapp magnet. Relative Strength Index (RSI)’s purple line fell from bullish territory on June 8; buying pressure placed the indicator above the neutral line at 60.5.
Chaikin Money Flow depicted strong capital inflows at the time of writing. Finally, Simple Moving Averages displayed optimistic signs for SOL as both 50 SMA (orange) and 100 SMA (red) lines remained under the candlesticks.


