
Bitcoin’s latest rally saw the more bullish influencers and traders on Twitter throw confetti online as they celebrated the rise of the king coin (yet again). Before you join the party, however, it’s important to slow down and consider the risk that investors who bought the dip might be in a mood to sell and make some quick profits now.
Here’s what the metrics actually reveal.
Finally at cruising altitude
At press time, Bitcoin was trading at $46,998.85, having rallied by 5.26% over the last 24 hours while appreciating by 14.75% over the past week. Meanwhile, the real celebrations were after the king coin briefly hiked above $47,000, before dropping back down again.
What contributed to this? Well, there’s no shortage of theories. These range from investors slowly getting over the shock of the Russia-Ukraine war to Santiment’s suggestion that Bitcoin shorts liquidations could have helped bump up prices as well.
? #Bitcoin launched to $47.2k, its highest price since January 3rd. The massive amount of #shorts that were growing on exchanges is the primary culprit for this jump. #Altcoins really saw a huge #short ratio at 1pm UTC, followed by $BTC at 6pm UTC, spiking all of #crypto. ? pic.twitter.com/vOi8YBmP4s
— Santiment (@santimentfeed) March 28, 2022
As far as exchange activity is concerned, Santiment’s data revealed that Bitcoin is swiftly running away from exchanges. Furthermore, at the last count, there were about 1.94 million BTC on exchanges, matching levels last seen in October 2018.
Additionally, the levels were still dropping at press time. Ergo, it seems that investors aren’t yet done buying BTC while it stays out of the historic sell zone.
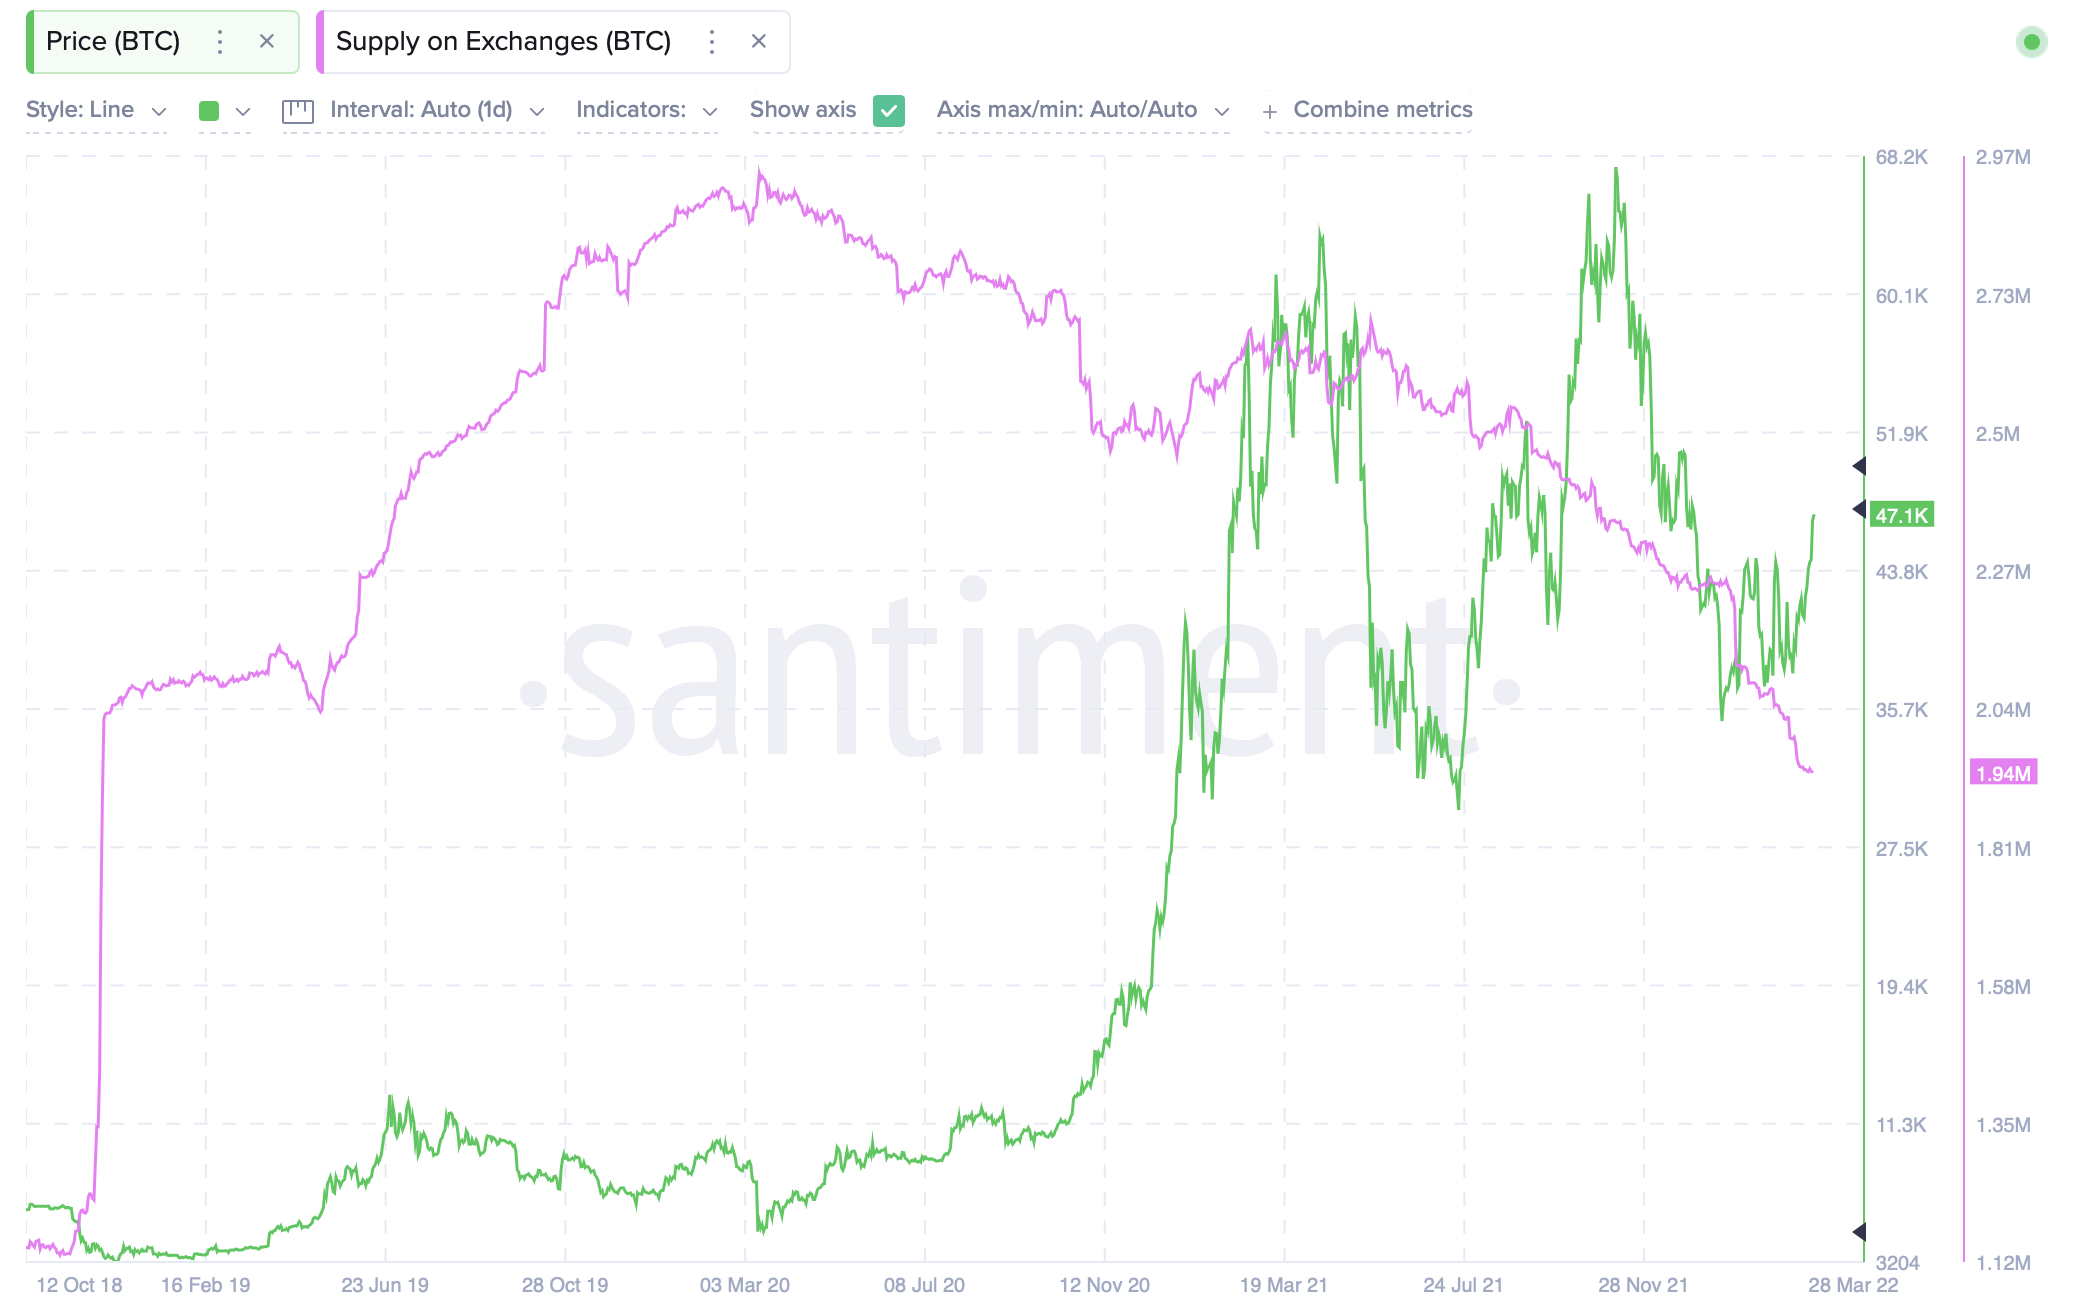
Source: Santiment
Now, many might have expected whales to jump in and start feeding. However, transactions over $1 million did not see any signifiant changes. It remains to be seen how whales react after BTC crosses the psychological threshold of $50,000.
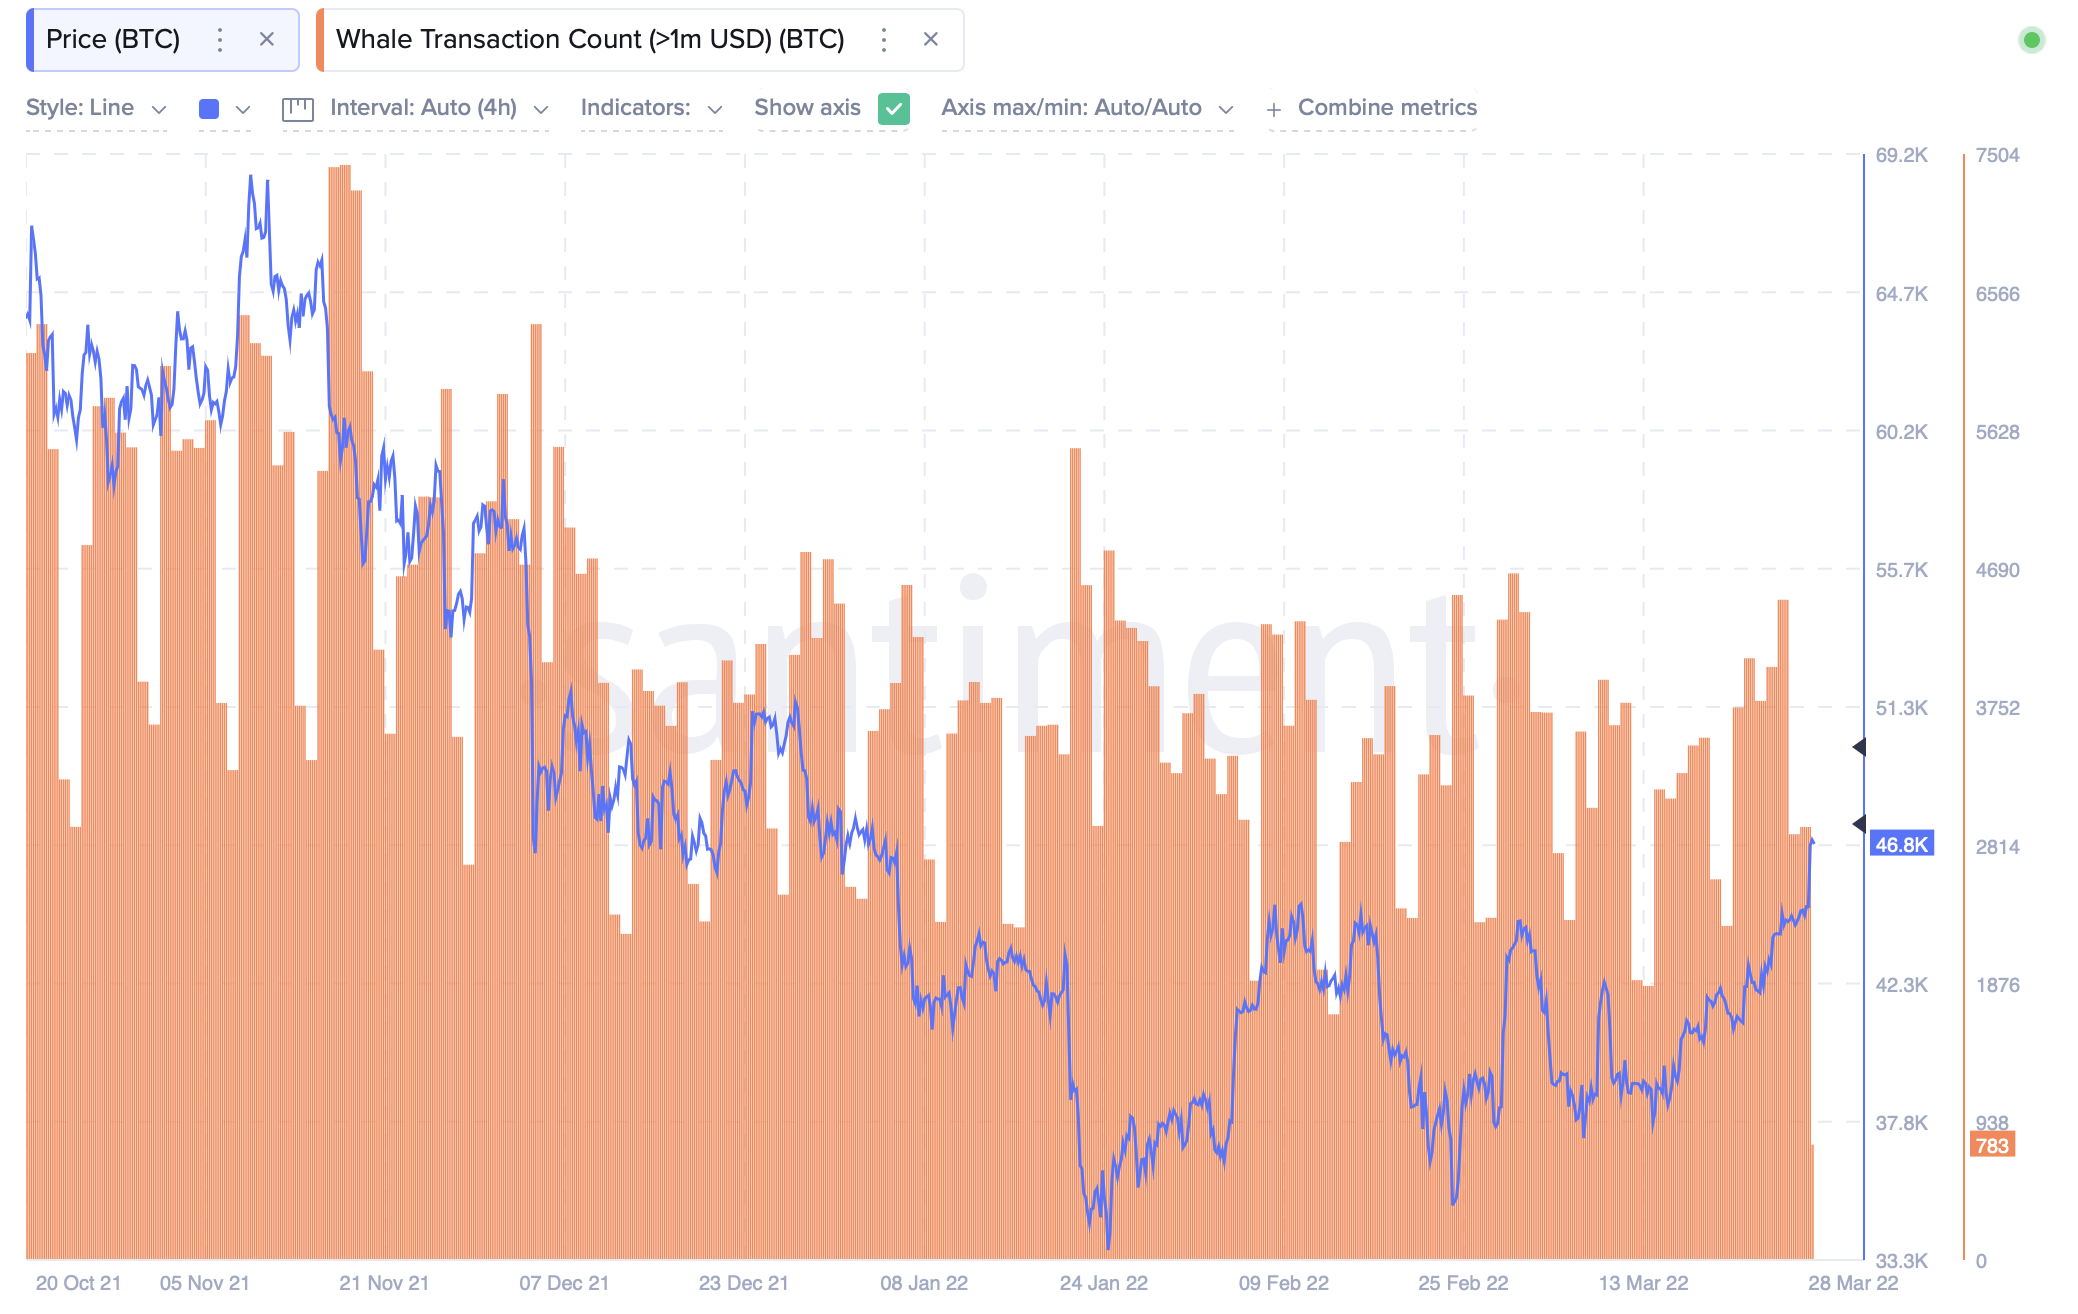
Source: Santiment
However, it’s important that weighted sentiments steer away from euphoric highs as these have the potential to trigger sell-offs. At press time, weighted sentiment was still in negative territory.
It’s worth pointing out here that BTC, at the time of writing, was moving towards a higher risk area.
? #Bitcoin has now returned all the way back to $46.8k for the first time since January 4th. The 11-week high comes as #inflation, #war, and #COVID19 fears have all eased significantly, giving $BTC traders an average mid-term trading return of over 10%. https://t.co/TNMZUPwxhd pic.twitter.com/WdSYC8kyTV
— Santiment (@santimentfeed) March 28, 2022
What are my options here?
Another factor to keep in mind is that 28 March marks the expiry date of 1,492.70 call options and 789.30 put options. The maximum pain price is estimated to be set at around $45,000. Most call volumes seemed to be concentrated at the $45,000 strike price, which could serve as a resistance of sorts.
Meanwhile, put volumes are focused on $44,000, which could lead to the formation of a support level. This will likely come as a relief to those bullish investors with less capital on their hands.
However, with over 1,900 call options set to expire next month, April Fool’s Day may be the time to look out for a harder resistance level.
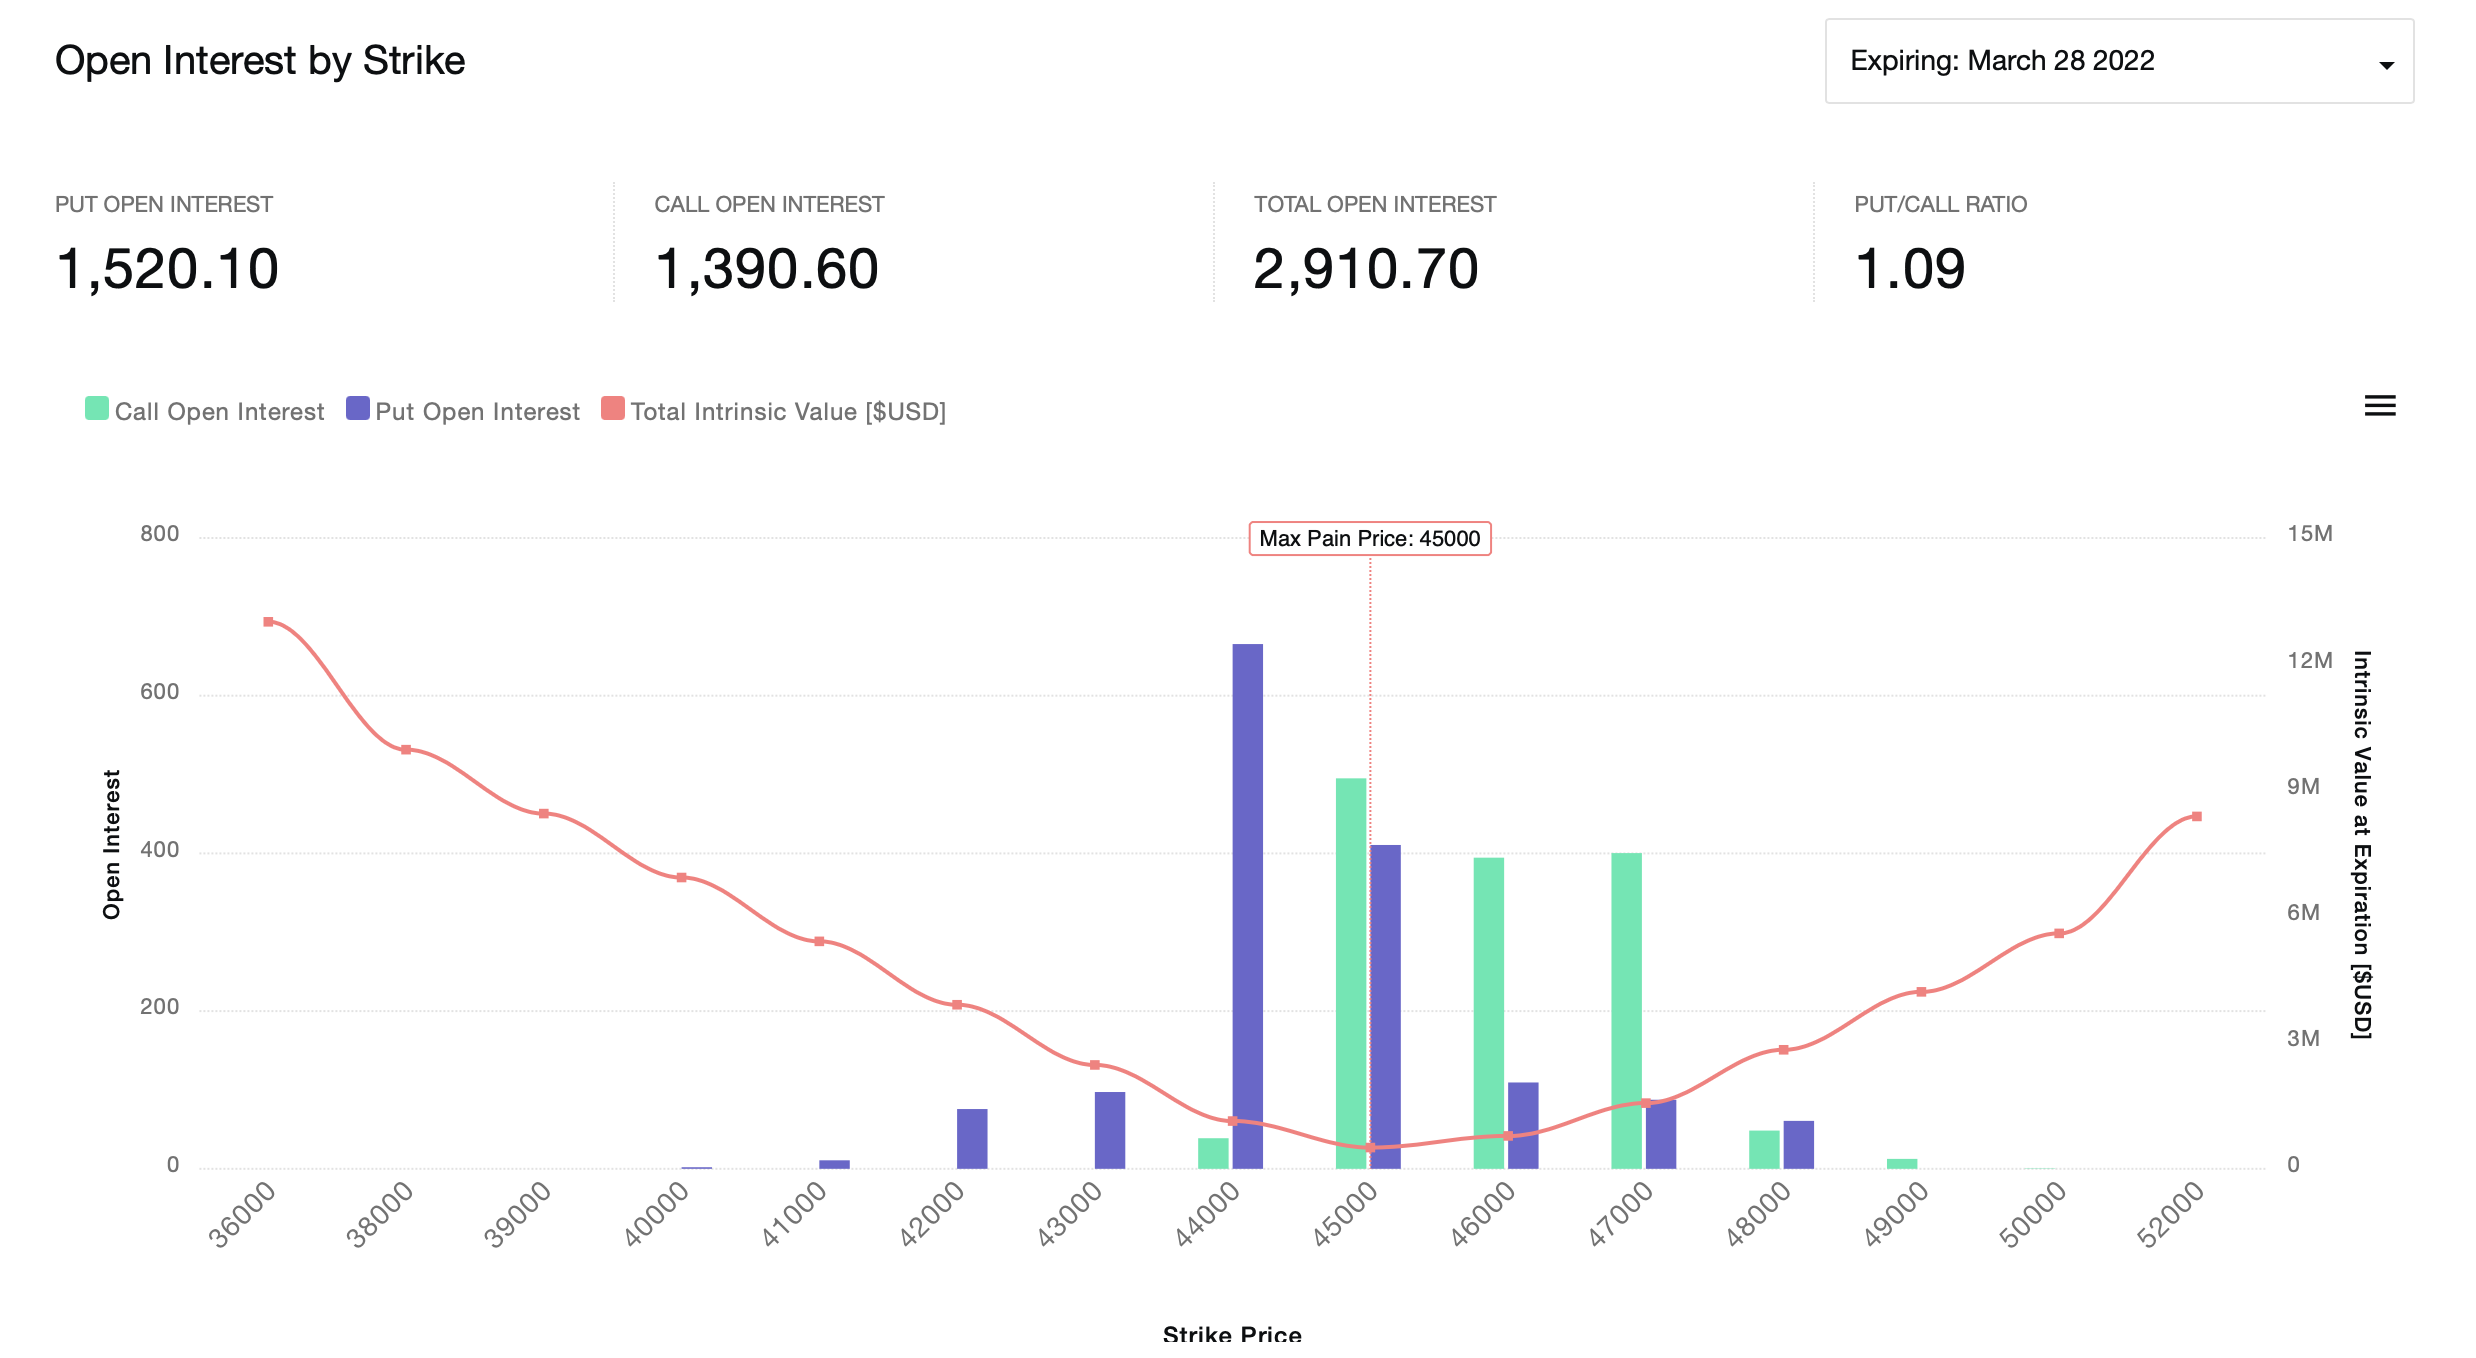
Source: coinoptionstrack.com