Bitcoin price prediction – Here’s how a new BTC Golden Cross can play out
After weeks of indifferent movement, will BTC's price do something different this time?

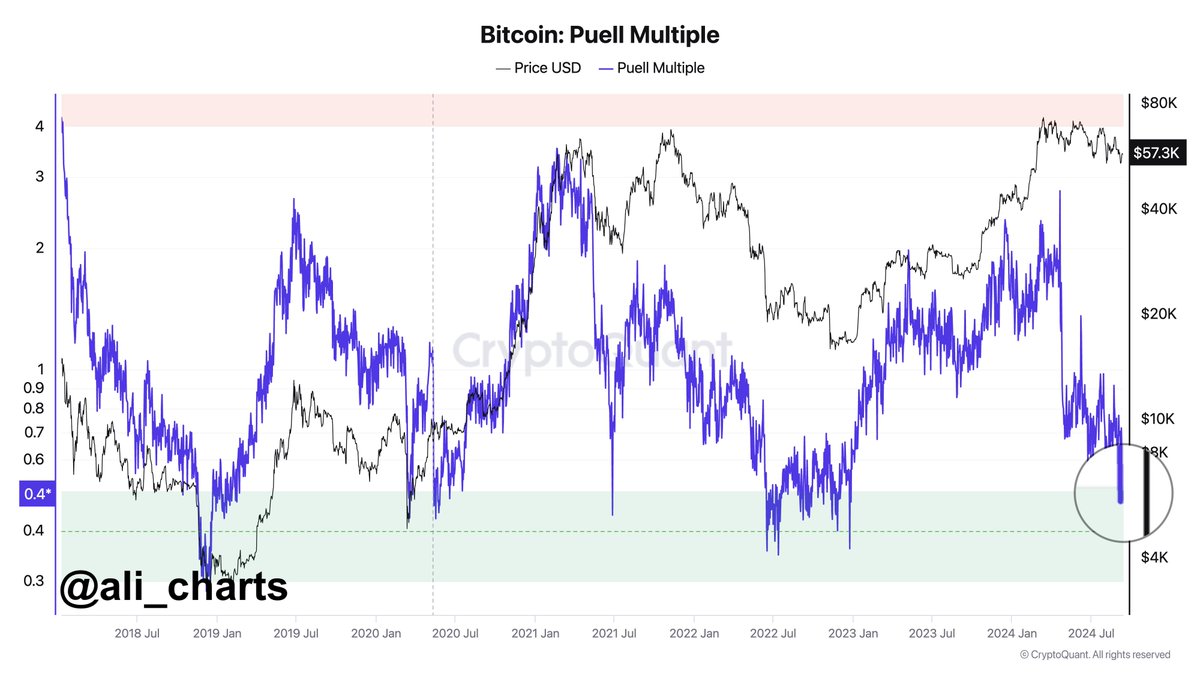
- Bitcoin’s Puell Multiple dropped below 0.4, signaling a market bottom and a fall in miner selling pressure
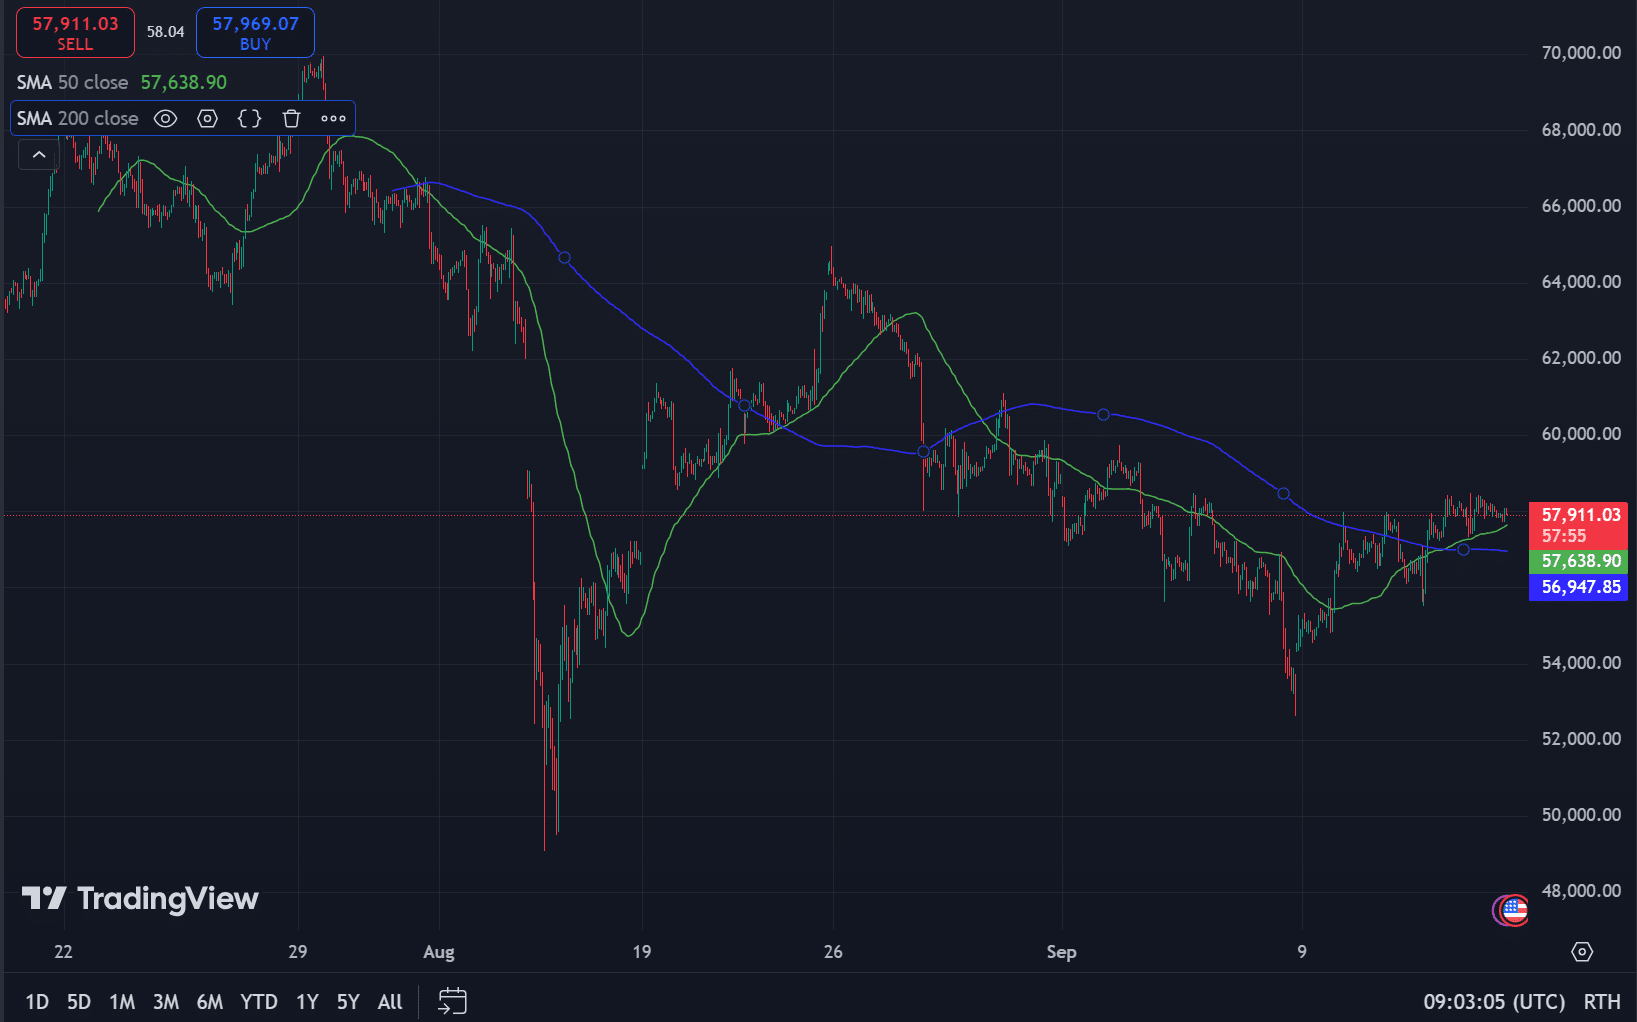
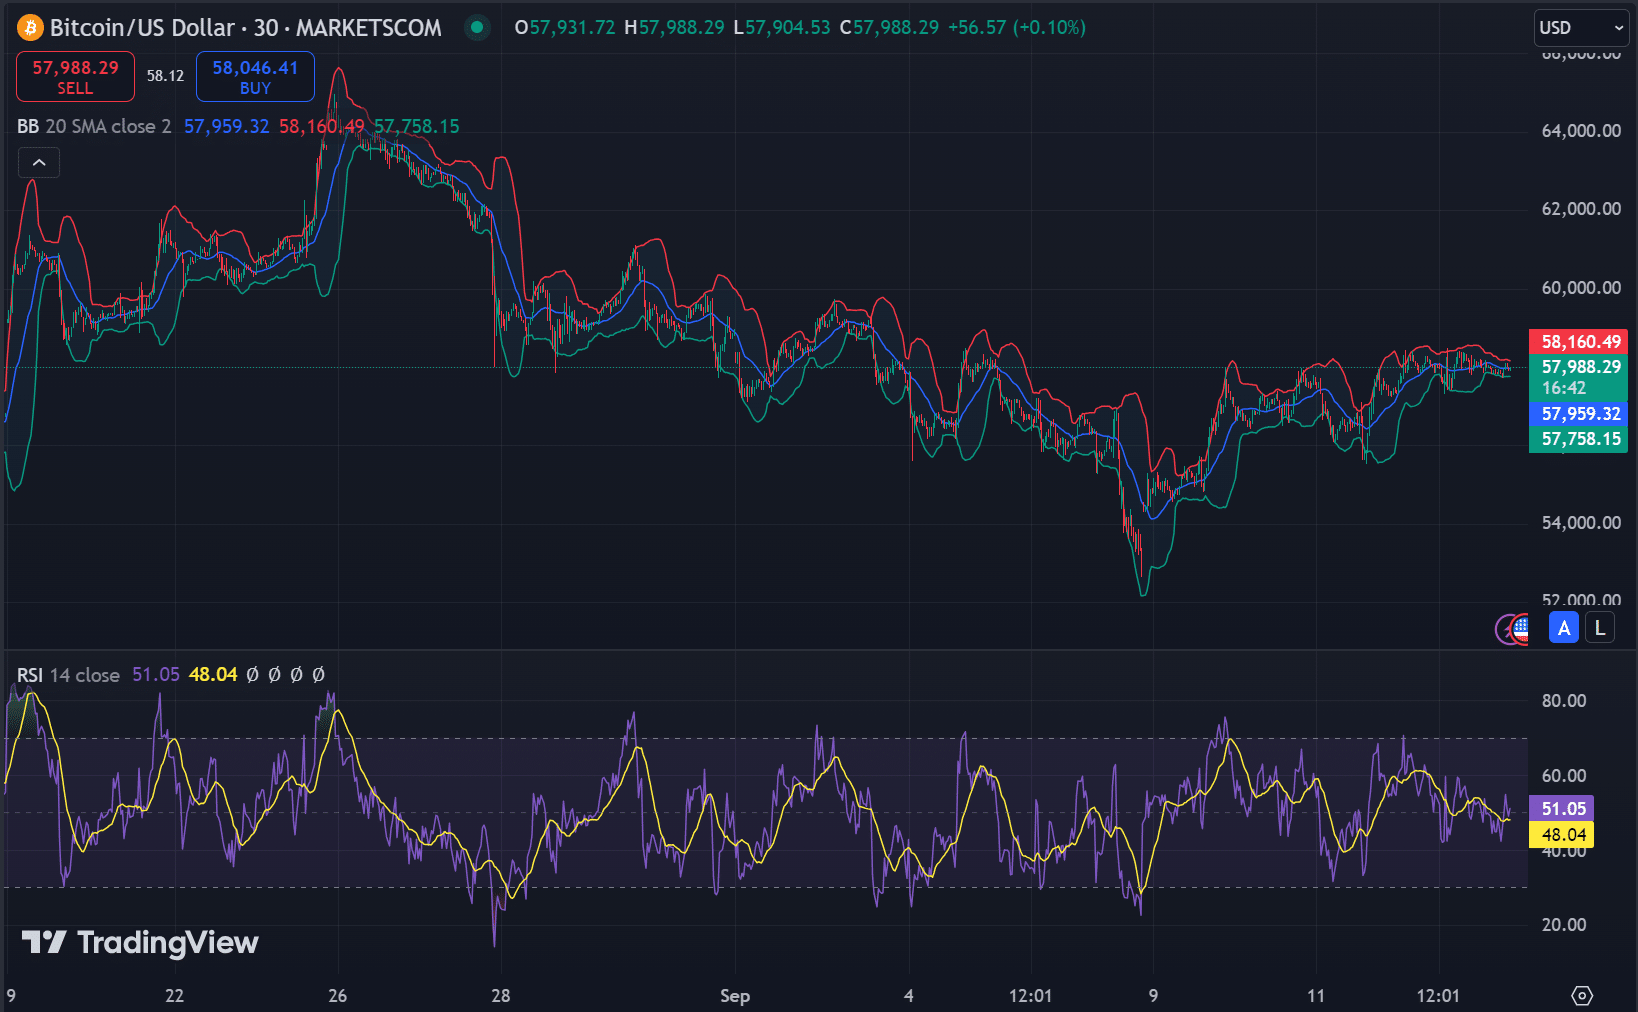
- A golden cross on the 2-month chart and tightening Bollinger Bands suggested a potential breakout
Bitcoin [BTC], at the time of writing, was flashing signs of potential bullish momentum, with the Puell Multiple dropping below 0.4. This coincided with a golden cross forming on the 2-month chart. These indicators, along with on-chain data, suggested that Bitcoin may be preparing for a significant price move. A closer look at the data is important to assess whether Bitcoin is really ready for a rally.
For example – The Puell Multiple fell below 0.4, indicating that Bitcoin miners are earning far less than their historical average. This was noted by analyst Ali Martinez on X (formerly Twitter). This metric has historically been associated with market bottoms, signaling that Bitcoin could be undervalued.
When miners earn less, they are less likely to sell. This reduces selling pressure in the market and often precedes a price recovery.
How are miners and on-chain activity supporting the bullish case?
Despite low miner earnings, Bitcoin’s network activity remains strong. Active addresses have risen by 0.93%, totaling 8.24k in the past 24 hours – A sign of greater network engagement.
This rising activity, combined with miners likely holding rather than selling, sets the stage for supply constraints that could drive the price higher.
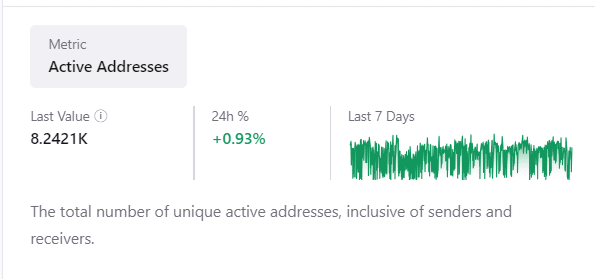
Miners holding onto their coins while on-chain activity increases often reduces supply. This might lead to a potential price uptick as demand remains steady or grows.
Golden Cross and other technical indicators
On the 2-month chart, Bitcoin formed a Golden Cross, one where the 50-period moving average crossed above the 200-period moving average. This pattern is a widely recognized bullish signal, especially on longer timeframes. This means that Bitcoin may be entering a sustained upward trend on the charts.
Additionally, the Relative Strength Index (RSI) at 51.05 signaled neutral market conditions, allowing room for upward movement.
Bollinger Bands seemed to be tightening too, with Bitcoin near the lower band at $57,758.15. This could mean that the asset is oversold and could see a bounce soon.
Is Bitcoin ready for a breakout?
With the Puell Multiple signaling a market bottom, the formation of a Golden Cross, and key technical indicators like the RSI and Bollinger Bands supporting a bullish scenario, Bitcoin may be ready for a potential breakout.
Reduced miner selling pressure, rising on-chain activity, and strong technical signals backed this hypothesis too.