Bitcoin prices fall 8% in five days – What about the $50k predictions?
Bitcoin showed a good chance that it could drop below the $40k level in the coming days.

Disclaimer: The information presented does not constitute financial, investment, trading, or other types of advice and is solely the writer’s opinion.
- Bitcoin briefly held the $43k zone as support.
- The swift drop that followed on 11 December showed that prices could be attracted to the large liquidity pools beneath $40k.
Bitcoin [BTC] registered sizeable gains in recent weeks, but the foray past $40k could have been a liquidity grab. The reversal at the $44.7k mark could highlight a local top after BTC bulls’ inability to defend a critical demand zone.
A recent AMBCrypto report noted that the $38k region could serve as support in the coming days. Technical analysis showed that a deeper drop could arrive, but it need not alarm long-term investors yet.
The breakout past the triangle pattern encouraged euphoria
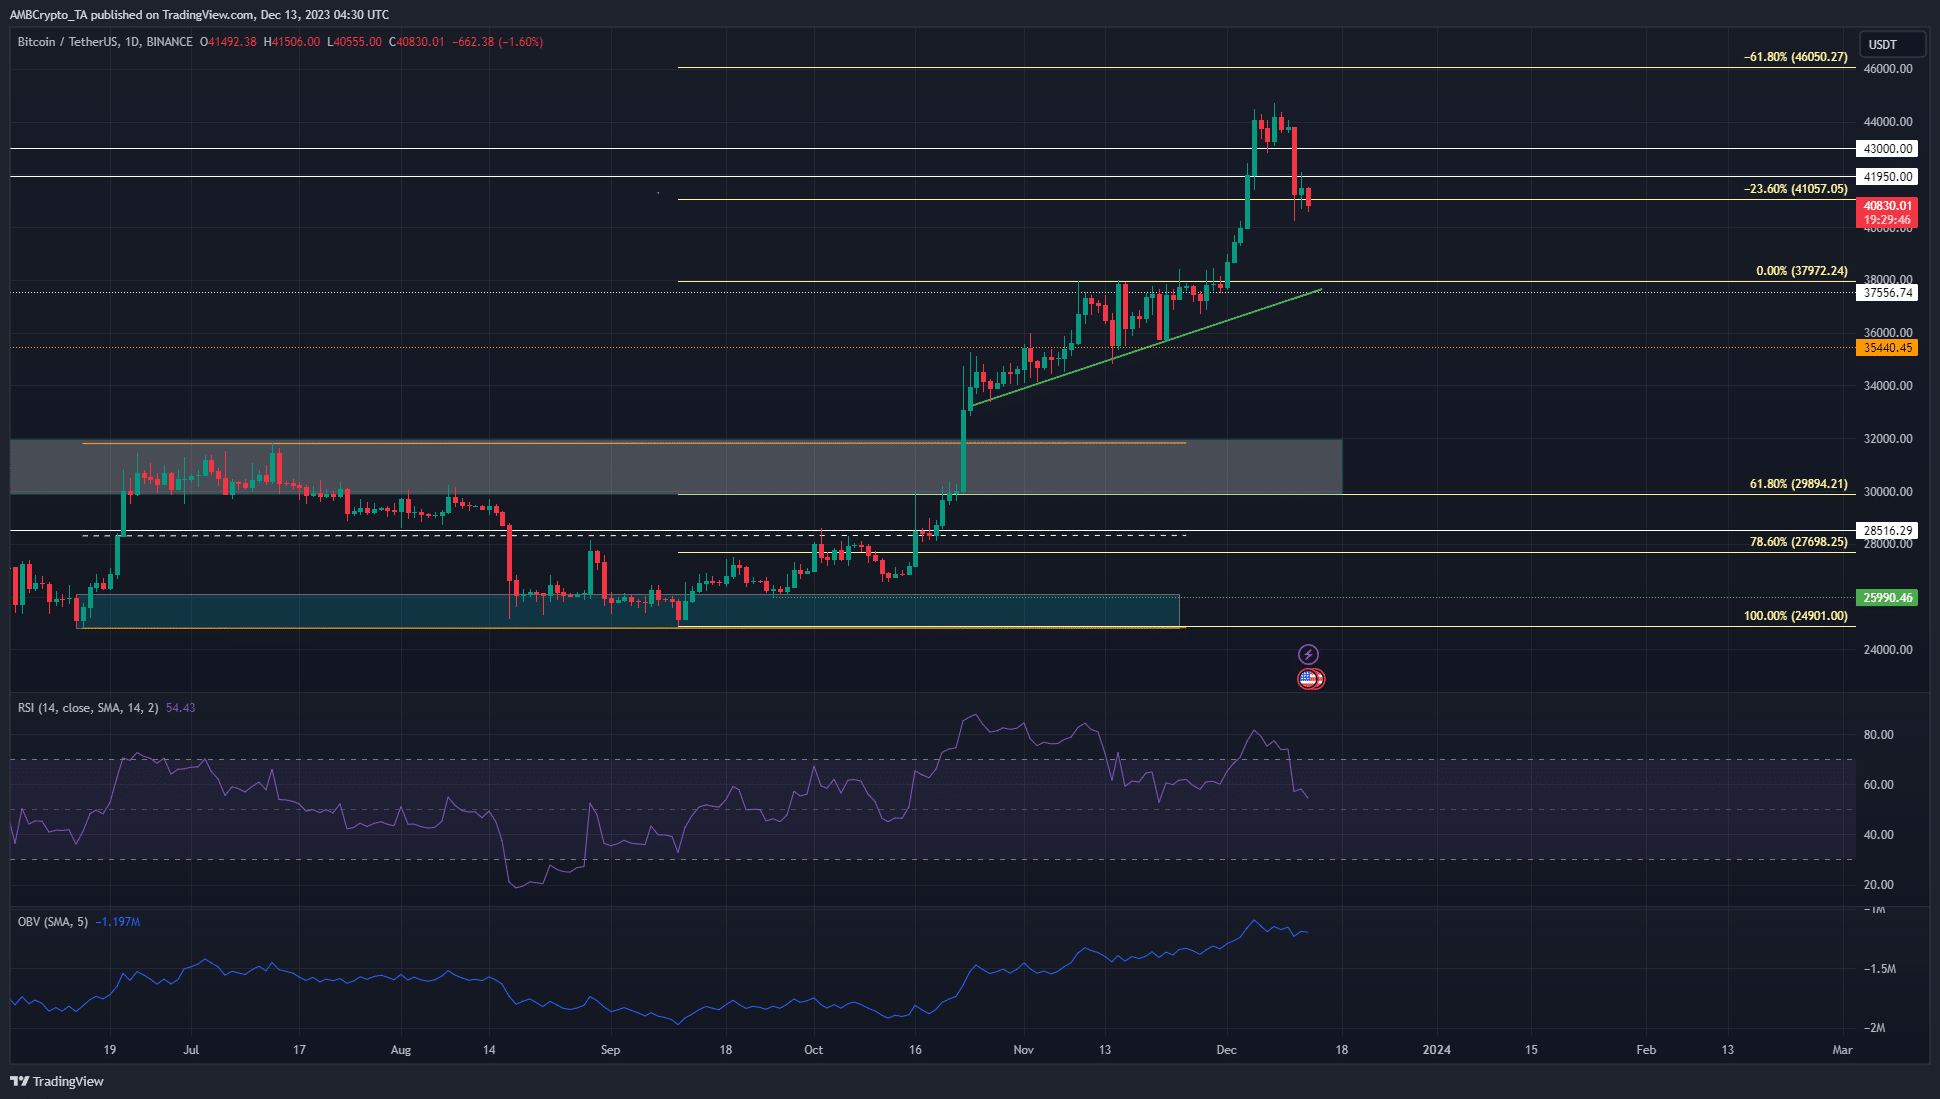
In November, BTC faced strong resistance at the $38k mark but continued to form a series of higher lows. This led to the formation of an ascending triangle pattern with the trendline support (green) being invalidation.
A breakout past $38k was followed by a rally that reached $44.7k on 8th December just a week later.
Since then, the bullish waves have receded. AMBCrypto’s analysis of the weekly chart of Bitcoin showed that the $41k-$43k region was significant since it had served as resistance in Q1 2022.
In the past week, BTC was able to climb past this resistance and retest it as support for a brief moment before crashing beneath this zone.
In doing so, it left fair value gaps which would likely serve as resistance upon the next test. At press time, the market structure of BTC was bullish on the one-day chart and would stay that way till the $36.7k level was broken.
The round number levels could be critical for traders and investors

Psychological support and resistance levels at round numbers are not a new phenomenon, and this was true for BTC as well. AMBCrypto’s analysis of Hyblock data underlined the importance of the $35k, $40k, and $45k levels.
The $39.6k-$40k region has a decent chunk of estimated liquidation levels, with even more piled up in the $44.9k-$45.7k zone.
Read Bitcoin’s [BTC] Price Prediction 2023-24
Beneath $40k, there were several levels of importance. The liquidation levels just above $35k were very likely to attract BTC to it should the king coin plunge below the $39k region.
Even after such a seemingly brutal drop, Bitcoin would retain its bullish structure on the higher timeframe charts. This was because the $35.3k level was an important support from just a month ago.


