Bitcoin: Recent gains, yes, but are they really enough to reverse BTC’s downtrend

Disclaimer: The findings of the following analysis are the sole opinions of the writer and should not be considered investment advice
Fear still hangs in the air, despite the relief rally of the past week for Bitcoin. The market structure remains bearish over higher timeframes. Right now, it is doubtful whether Bitcoin really has enough demand to push it past crucial areas of supply. However, the sellers could force one more leg south in the weeks to come.
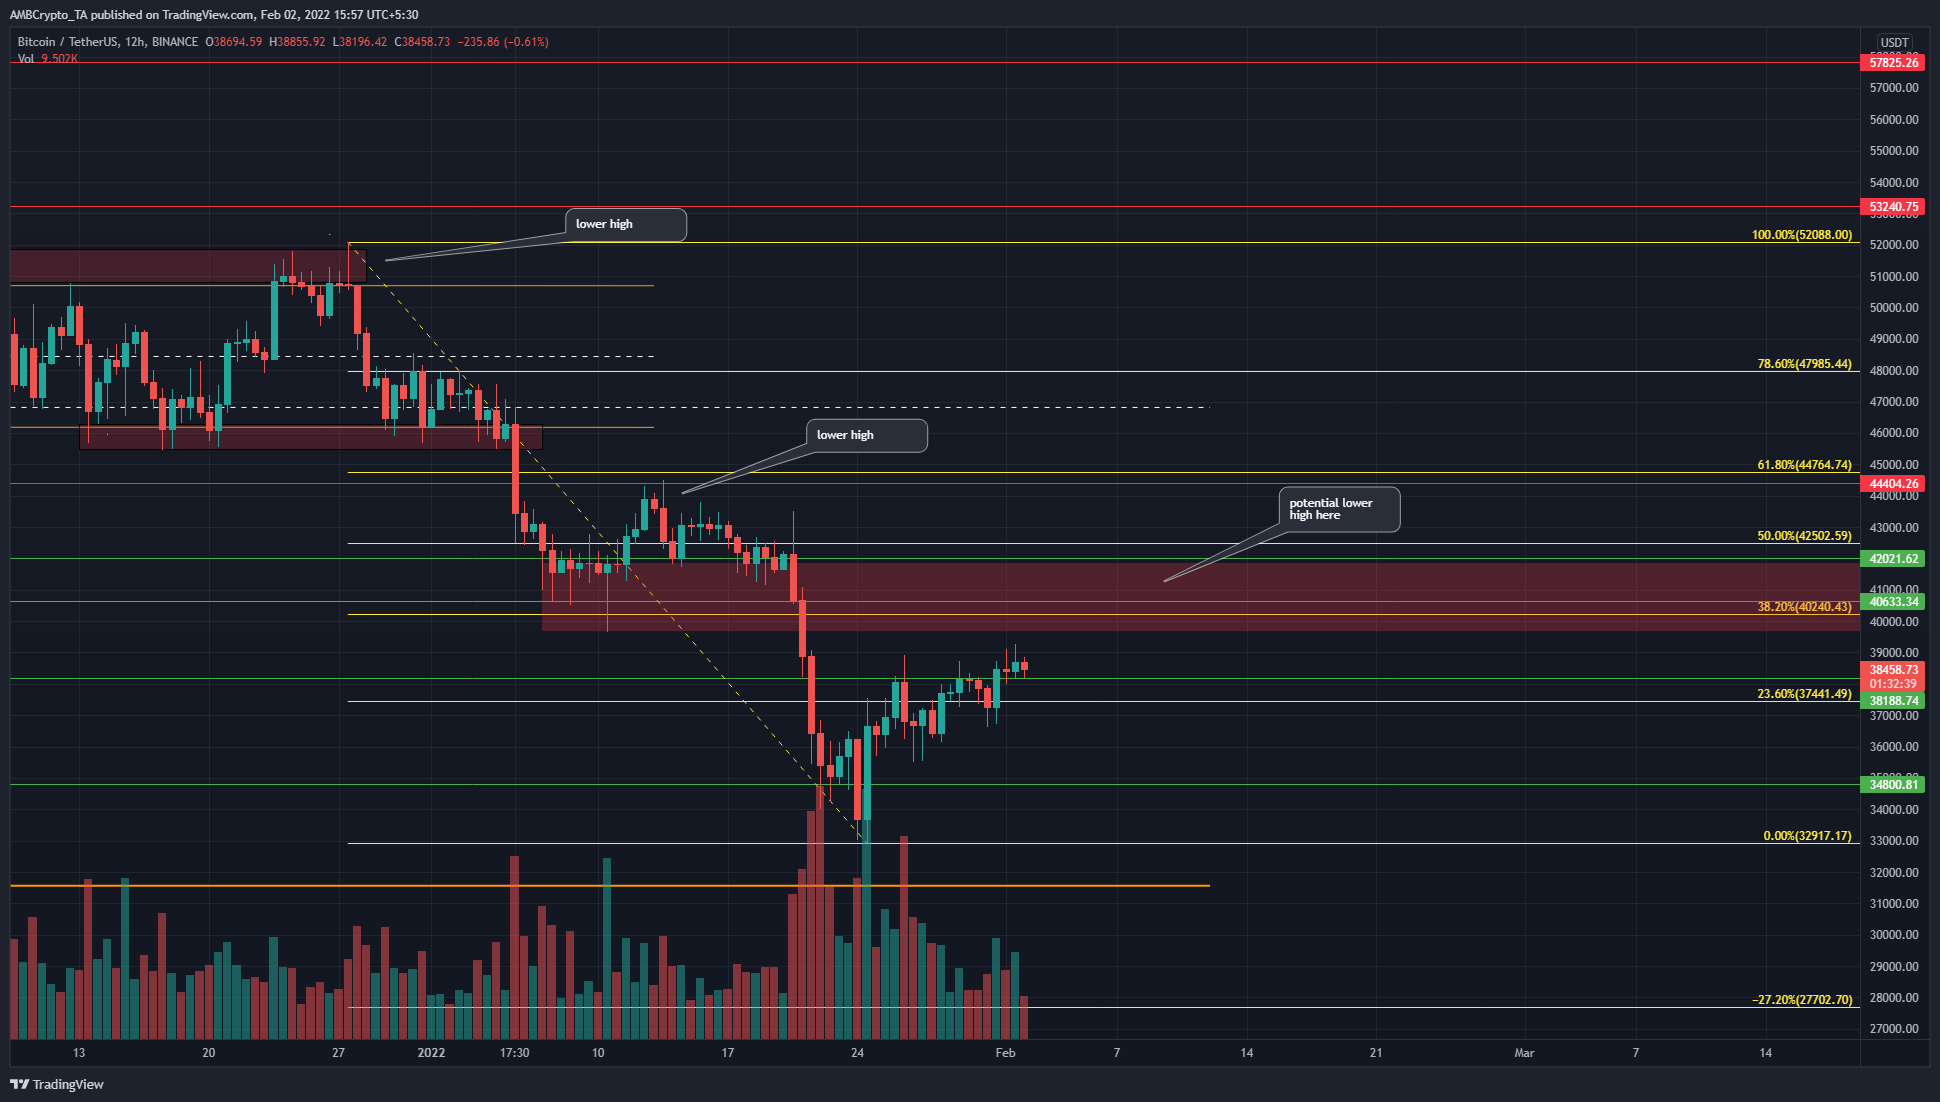
On the 12-hour chart, we can see that Bitcoin has made a series of lower highs over the past six weeks. In December, the price appeared to range between $45k and $51k. Since then, it has broken down decisively beneath its $44.8k and $40.6k support levels.
Going further back, it can be seen that the market structure flipped bearish in late November when BTC broke down under its former lows at $58.4k to hit new lows of $53.6k.
At the time of writing, the $40.6k-$42k area (red box) held notable significance. Earlier in January, the price saw wicks deep into this territory before rebounding towards $44k. Although the bounce was weak, the candlewicks showed demand. When BTC crashed right through this area, it showed that buyers were exhausted. It also highlighted an area where bears will be looking to enter the fray once again.
Using Fibonacci retracement and extension levels based on BTC’s drop from $52k to $32.9k, we can see that the 27.2% extension level lay at $27.7k, marking it as an area where a bounce might happen.
Rationale
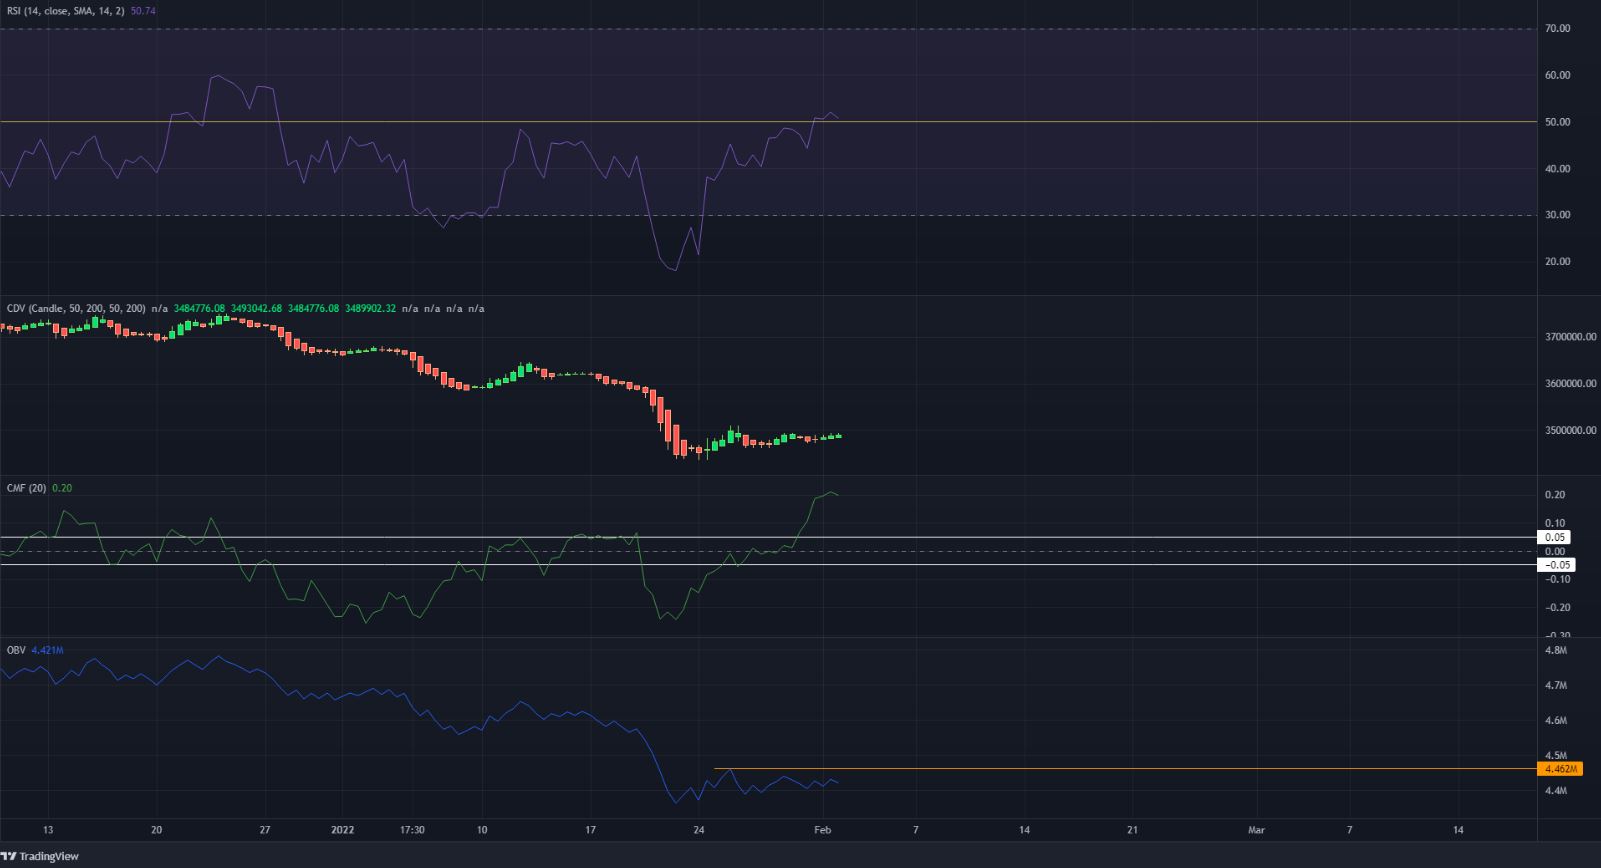
The RSI struggled to climb past the neutral 50-mark on the 12-hour chart. The Cumulative Delta Volume showed that compared to the latest drop, the relief rally had all the buying strength of wet cement. The OBV concurred and refused to climb higher to show a distinct lack of demand behind the rally.
Only the Chaikin Money Flow pictured strong capital flow into the market. Alas, the evidence at hand pointed in the opposite direction.
Conclusion
The indicators and the market structure pointed towards a sustained downtrend, with sellers being strong. Buyers were present but did not appear strong enough to end the downtrend. Further pain could be ahead for the crypto-markets.