
Bitcoin created history on 25th October when it registered a surge of 40% within 24-hours, briefly pushing its price above $10,000 for the first time in 3-months. The hike came in as a huge relief for the pioneer of the cryptocurrency market, considering major indicators were suggesting strong bearish influence until then.
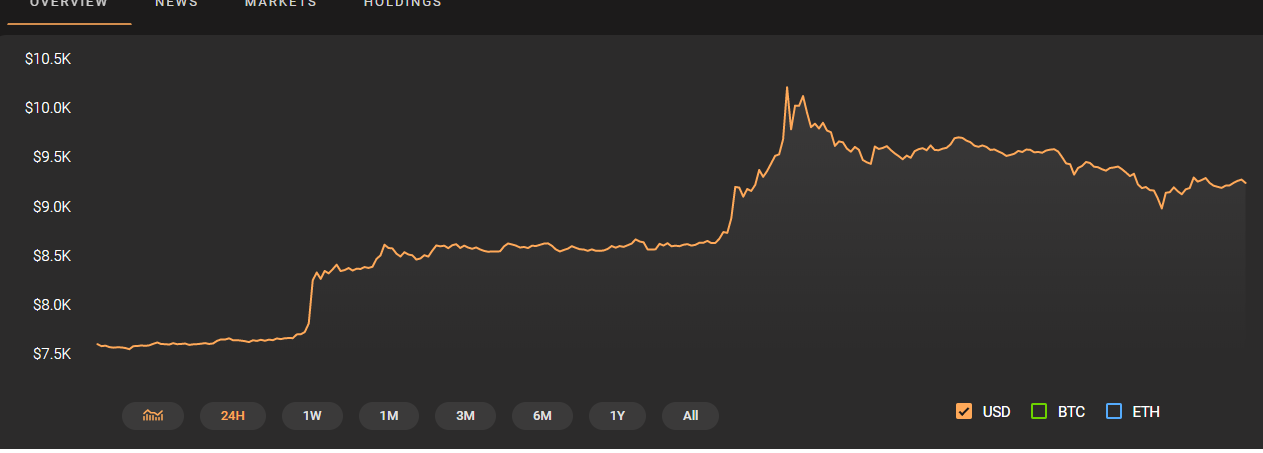
Source: Coinstats
According to CoinMarketCap, at press time, Bitcoin was trading at $9,244.74, recording an upsurge of more than 22.22% on the 24-hour price chart.
1-Hour Price Chart
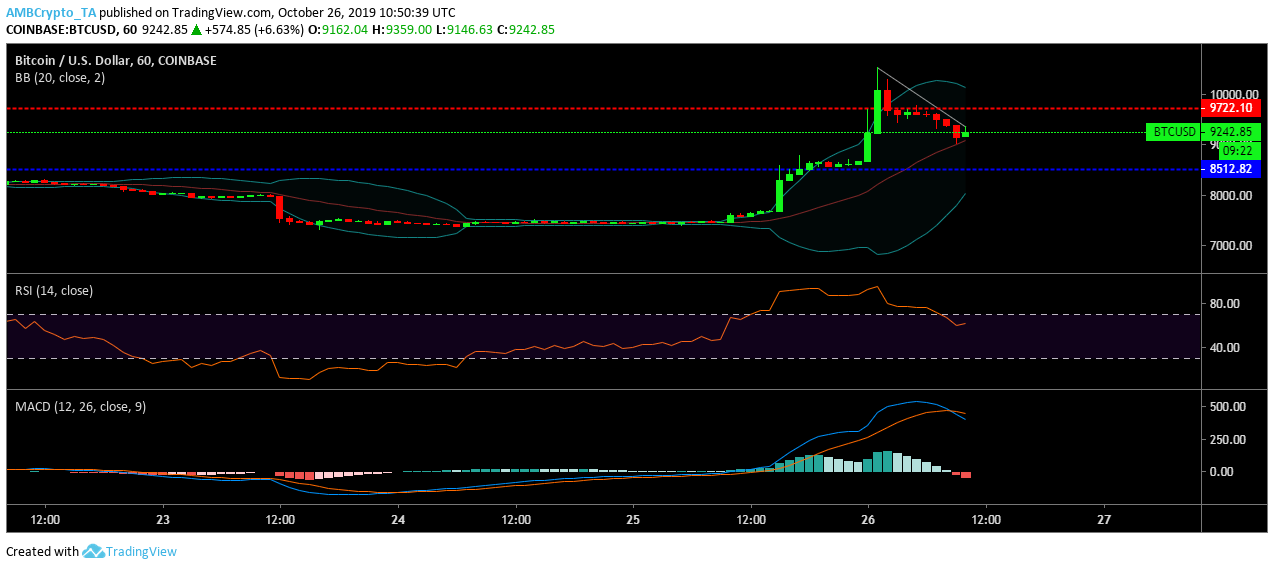
Source: BTC/USD on TradingView
In 1-hour price chart, Bitcoin formed support at $8,512.81, while the king coin required to breach through the resistance of $9,722.10 to continue its upward trend. Bitcoin also showed a downtrend in the aftermath of a sudden rise, starting from $10,491 to $9,347.42.
Bollinger Band showed that price volatility of the coin saw a significant rise, which was apparent given how fast Bitcoin rose yesterday when it gained almost $1000 in an hour.
RSI indicator suggested that the digital currency was overbought for the most part on 25th October and early hours of 26th October. The buyers continued to dominate the market despite the slowdown in price surge.
MACD indicator showed a bearish crossover in the second half of 26th October, while the sentiment was highly bullish starting on 25th October.
1-Day Price Chart
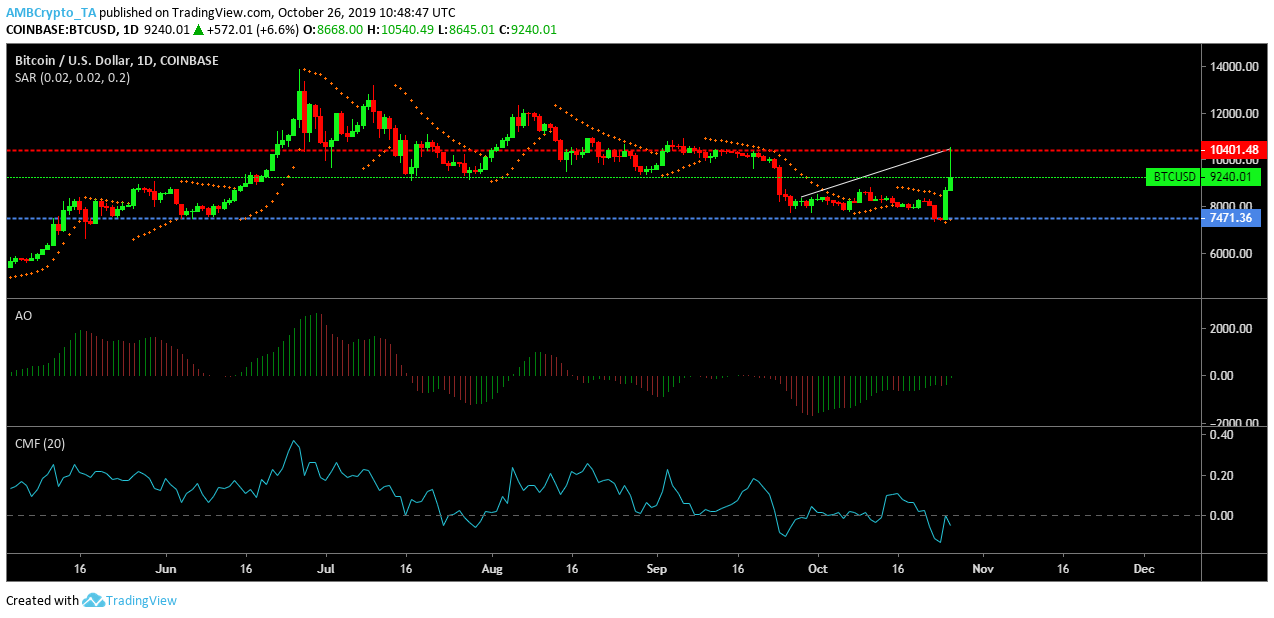
Source: BTC/USD on TradingView
In 1-day price chart, Bitcoin formed immediate support at $7471.36 while it required to breach though a resistance of $10,401.48 to witness another bullish price movement. The cryptocurrency registered an uptrend starting from $8,455.47 to $10,485.14.
Parabolic SAR Indicator acted as a resistance for the price since 18th October, but the price boom on 25th October saw a trend reversal and since then it has been acting as a support for the king coin.
Awesome Oscillator indicated that the market was fluctuating in the long term with minimal momentum, however, in the short term, it was on the bullish side.
Chaikin Money Flow or CMF showed that amount of capital flowing into the market was low since 21st October, but on 25th the capital inflow registered a significant boost.
Conclusion
Bitcoin’s massive rally on 25th October saw several trend reversals, which were persistent for the last 3-months, the buyers were in a dominant position while the capital inflow also registered a significant rise.


![Ethereum's [ETH] 11% rebound - Is greed fueling a bottom or is fear driving a trap?](https://ambcrypto.com/wp-content/uploads/2025/04/Ritika-8-400x240.webp)