Bitcoin set to plunge down the price charts once more as bears target $25.2k
Bitcoin bulls late to the party paid the price in recent weeks. The Bitcoin rejection broke the market structure on the H12 timeframe on 19 April, and more downside was expected.

Disclaimer: The information presented does not constitute financial, investment, trading, or other types of advice and is solely the writer’s opinion.
- The retest of the breaker can offer bears a good risk-to-reward selling opportunity.
- Lower timeframes showed speculators shorting BTC with large volumes in recent days.
Bitcoin [BTC] faced rejection from the $30k resistance zone in mid-April. Like clockwork, the losses Bitcoin faced in subsequent weeks were reflected across the altcoin market. A shift in sentiment toward the king saw investors flee to stablecoins, evidenced by the rising Tether [USDT] dominance.
Read Bitcoin’s [BTC] Price Prediction 2023-24
Short-term BTC holders were already in profit after BTC’s move above $25.2k. The subsequent rally caught many late bulls offside and the report highlighted that SOPR fell below 1 to indicate many addresses were selling their Bitcoin at a loss.
Retest of bearish H12 breaker means bulls likely to have a torrid time
Bitcoin bulls late to the party have already paid the price in recent weeks. The Bitcoin rejection broke the market structure on the H12 timeframe on 19 April.
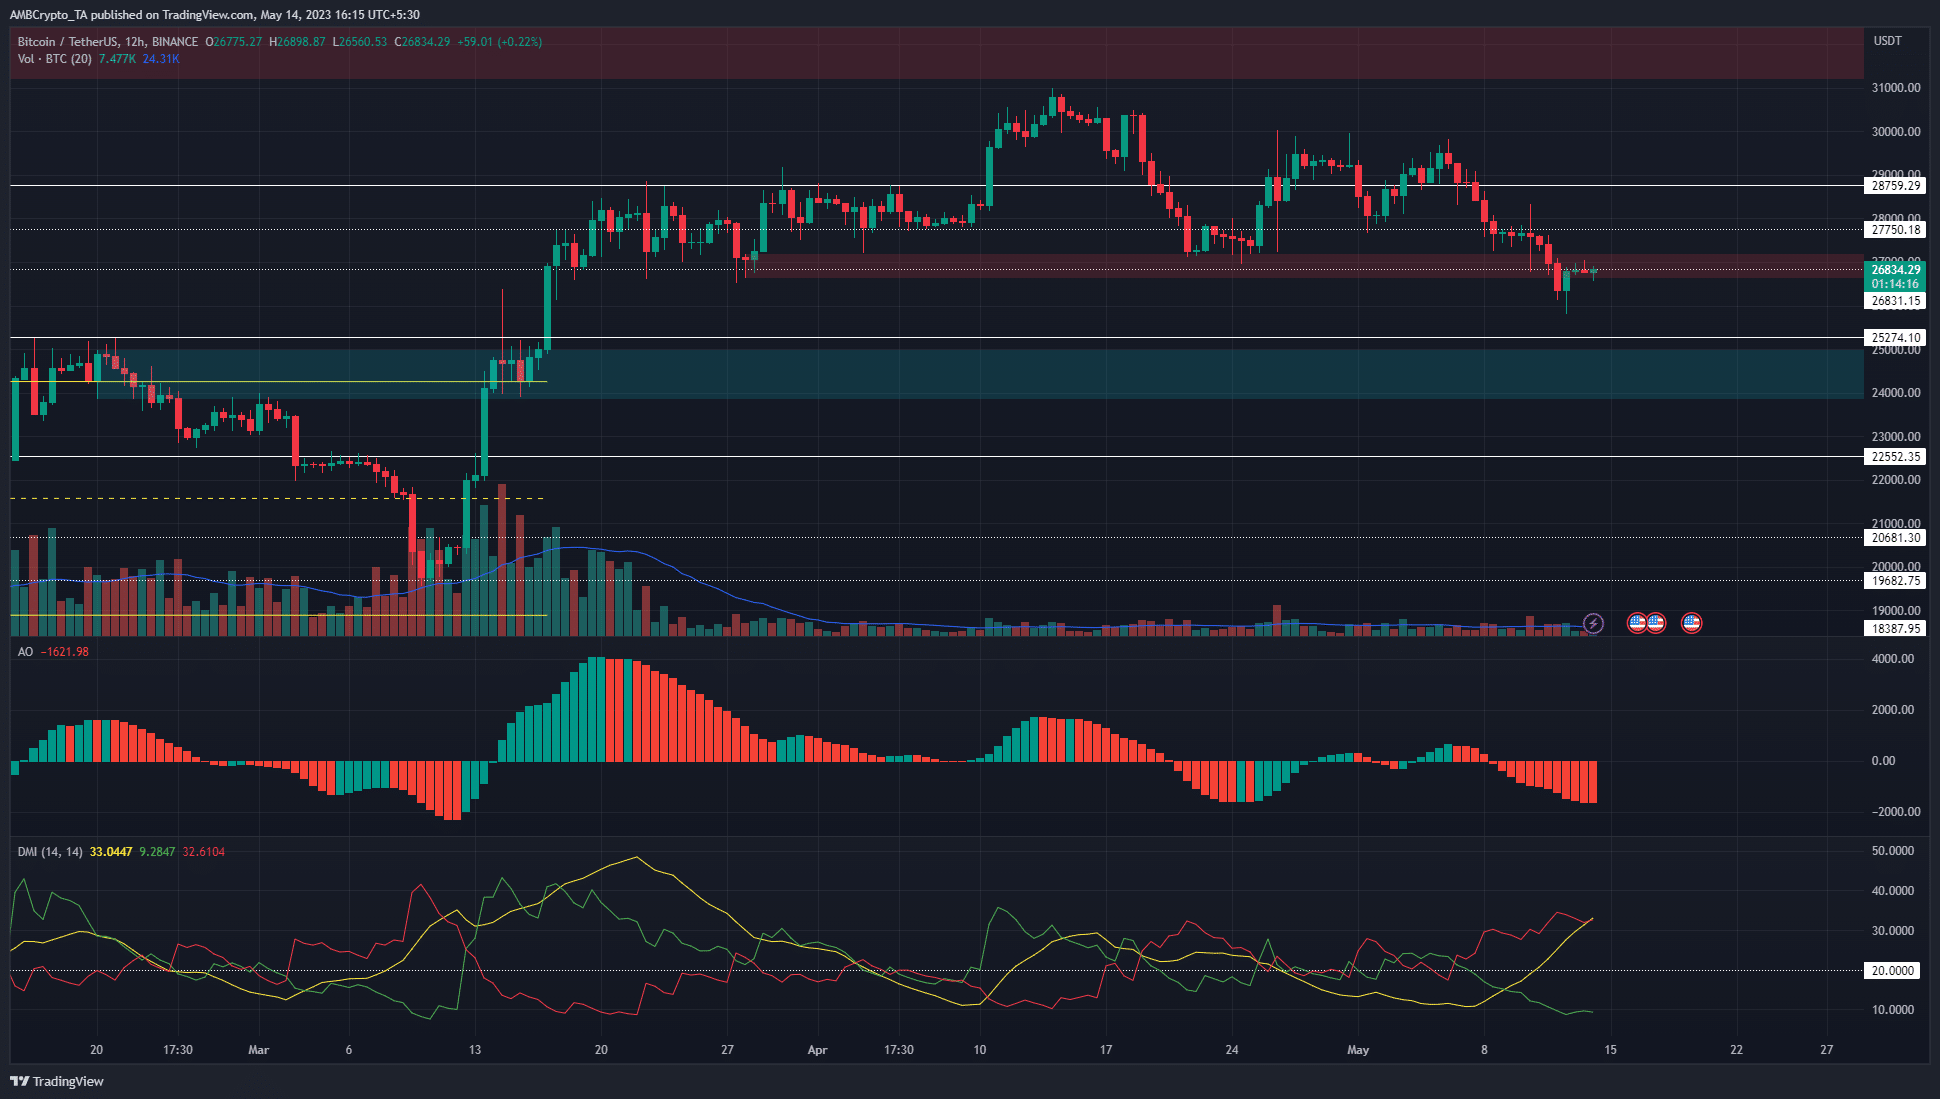
On 8 May, BTC slipped below $27.8k and at the time of writing it hovered around the $26.8k area.
This was a region of significance for traders as it represented an H12 bullish order block from 28 March. Yet, the bulls failed to defend this zone and the bullish OB was flipped to a bearish breaker.
The Awesome Oscillator moved below the zero line and registered red bars on its histogram to indicate strong bearish momentum.
Is your portfolio green? Check the Bitcoin Profit Calculator
The Directional Movement Index also showed a strong downtrend in progress, with the -DI (red) and ADX (yellow) both above the 20 mark.
To the south, the next levels to watch out for are $25.2k and $22.5k. There was a bullish order block beneath $25.2k in the $24k-$25k area that could act as a demand zone.
Month of May witnessed robust bearish sentiment in the futures markets
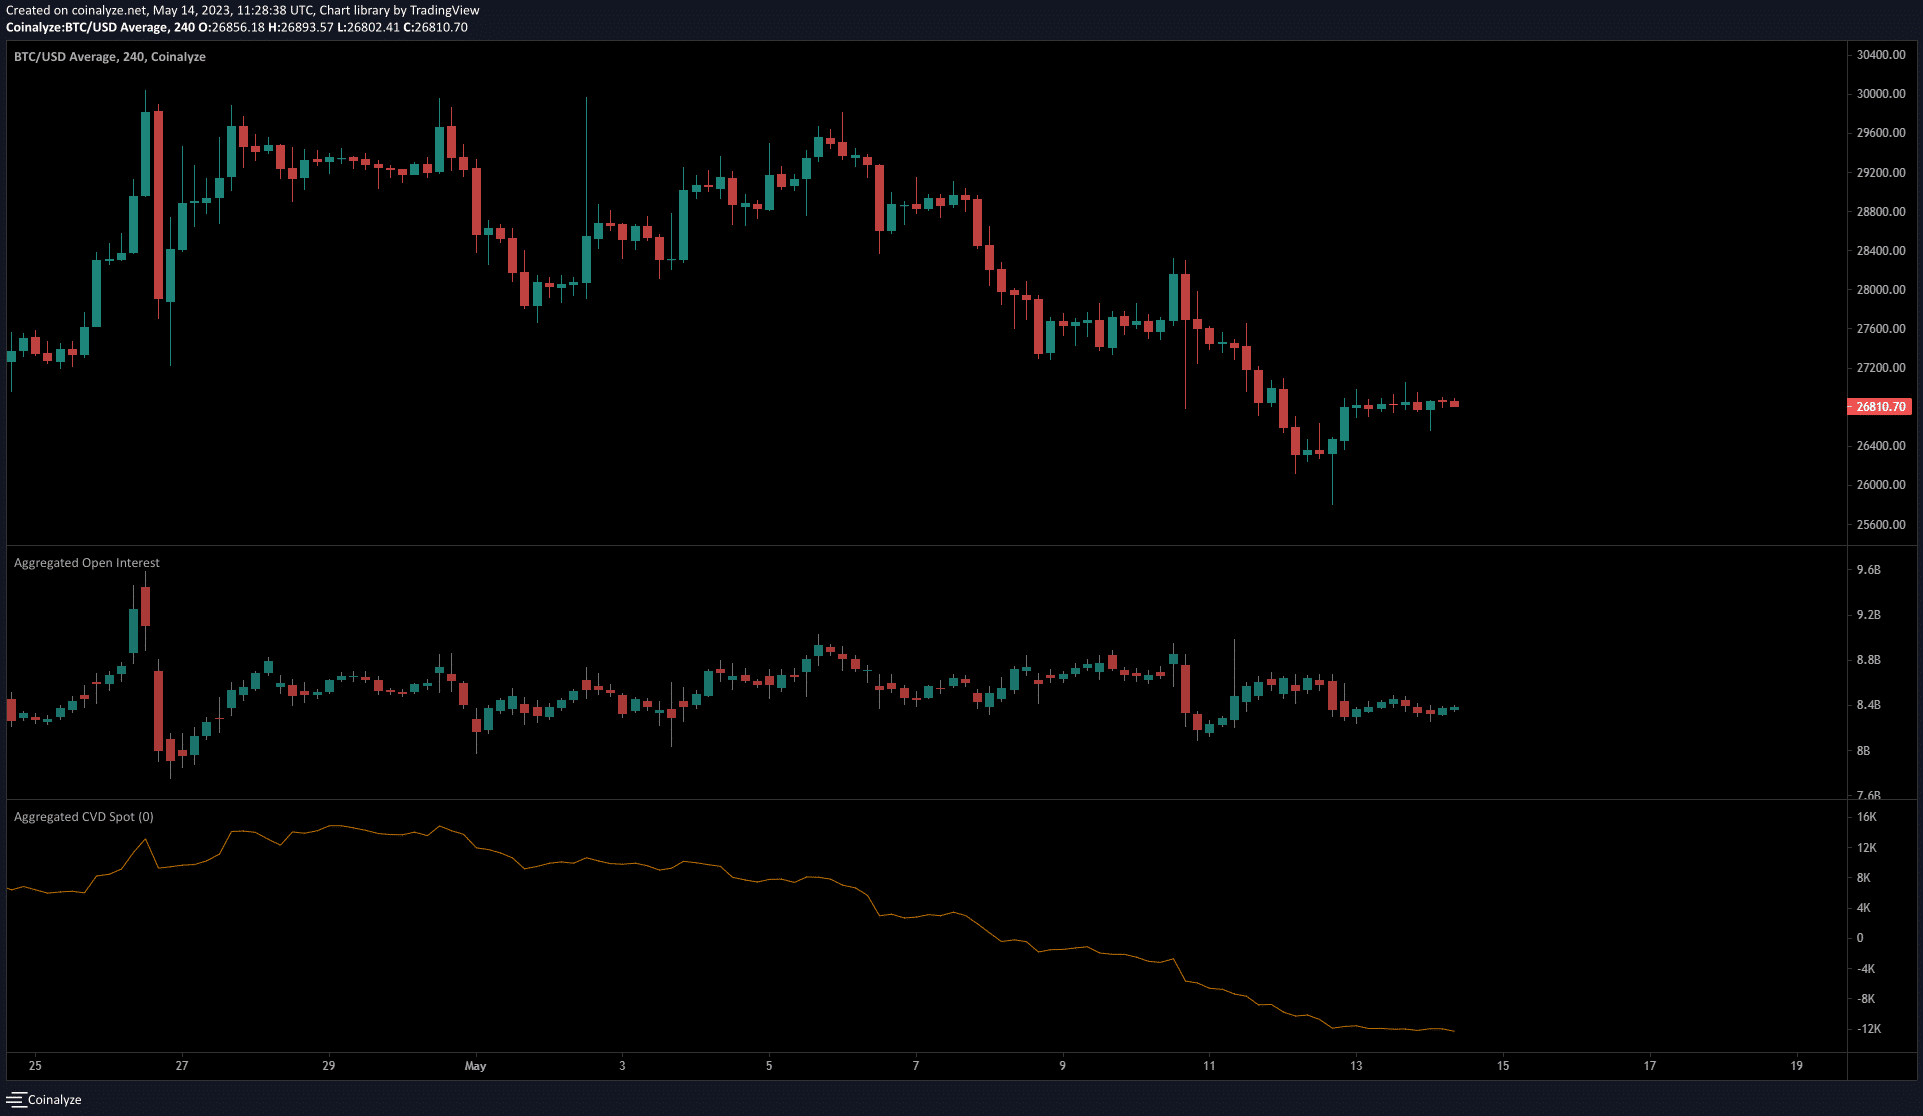
Additionally, on 8 May and 11 May, the Open Interest rose significantly while the prices fell lower. This indicated futures traders shorted BTC en masse and was a sign of extreme bearish sentiment on the lower timeframes.
On both these days, BTC dived by close to 2.5% and gave sellers enormous confidence. Further losses can occur in light of the lower timeframe sentiment and the higher timeframe bearish structure.


