Bitcoin: Short-term holders remain underwater
Last week's unexpected decline in Bitcoin's price forced many of its short-term holders to sell their coins at a loss. With key momentum indicators plummeting to record lows, BTC distribution has increased among daily traders.

- Bitcoin’s SOPR for its short-term holders fell below 1 following last week’s price decline.
- This meant that these investors have since traded at a loss.
Bitcoin’s [BTC] short-term holders continued to distribute their holdings at a loss as the Spent Output Profit Ratio for this cohort of investors trailed downward at press time.
Read Bitcoin’s [BTC] Price Prediction 2023-2024
Short-Term Holder Spent Output Profit Ratio (STH-SOPR) is a metric used to gauge the profitability of short-term holders of a particular crypto asset. It generally offers insights into whether investors who have held a particular asset for three to six months are in a profitable or unprofitable position.
If the STH-SOPR is above 1, it indicates that short-term holders, on average, are selling their coins at a profit. Conversely, if the STH-SOPR is below 1, it suggests that these holders are selling at a loss.
Commenting on the impact of last week’s deleveraging event on BTC’s short-term holders, pseudonymous CryptoQuant analyst Onchained noted that the STH-SOPR fell to 0.96.
According to Onchained, This STH-SOPR level was similar to a previous price correction in March 2023, when BTC’s price declined from $25,000 to $19,800, and the STH-SOPR also dropped to 0.96.
This metric was 0.98 at press time, according to data obtained from CryptoQuant. With BTC exchanging hands above $26,000, “short-term holders are still selling at a loss, but the losses are less significant.”

Record lows in BTC distribution
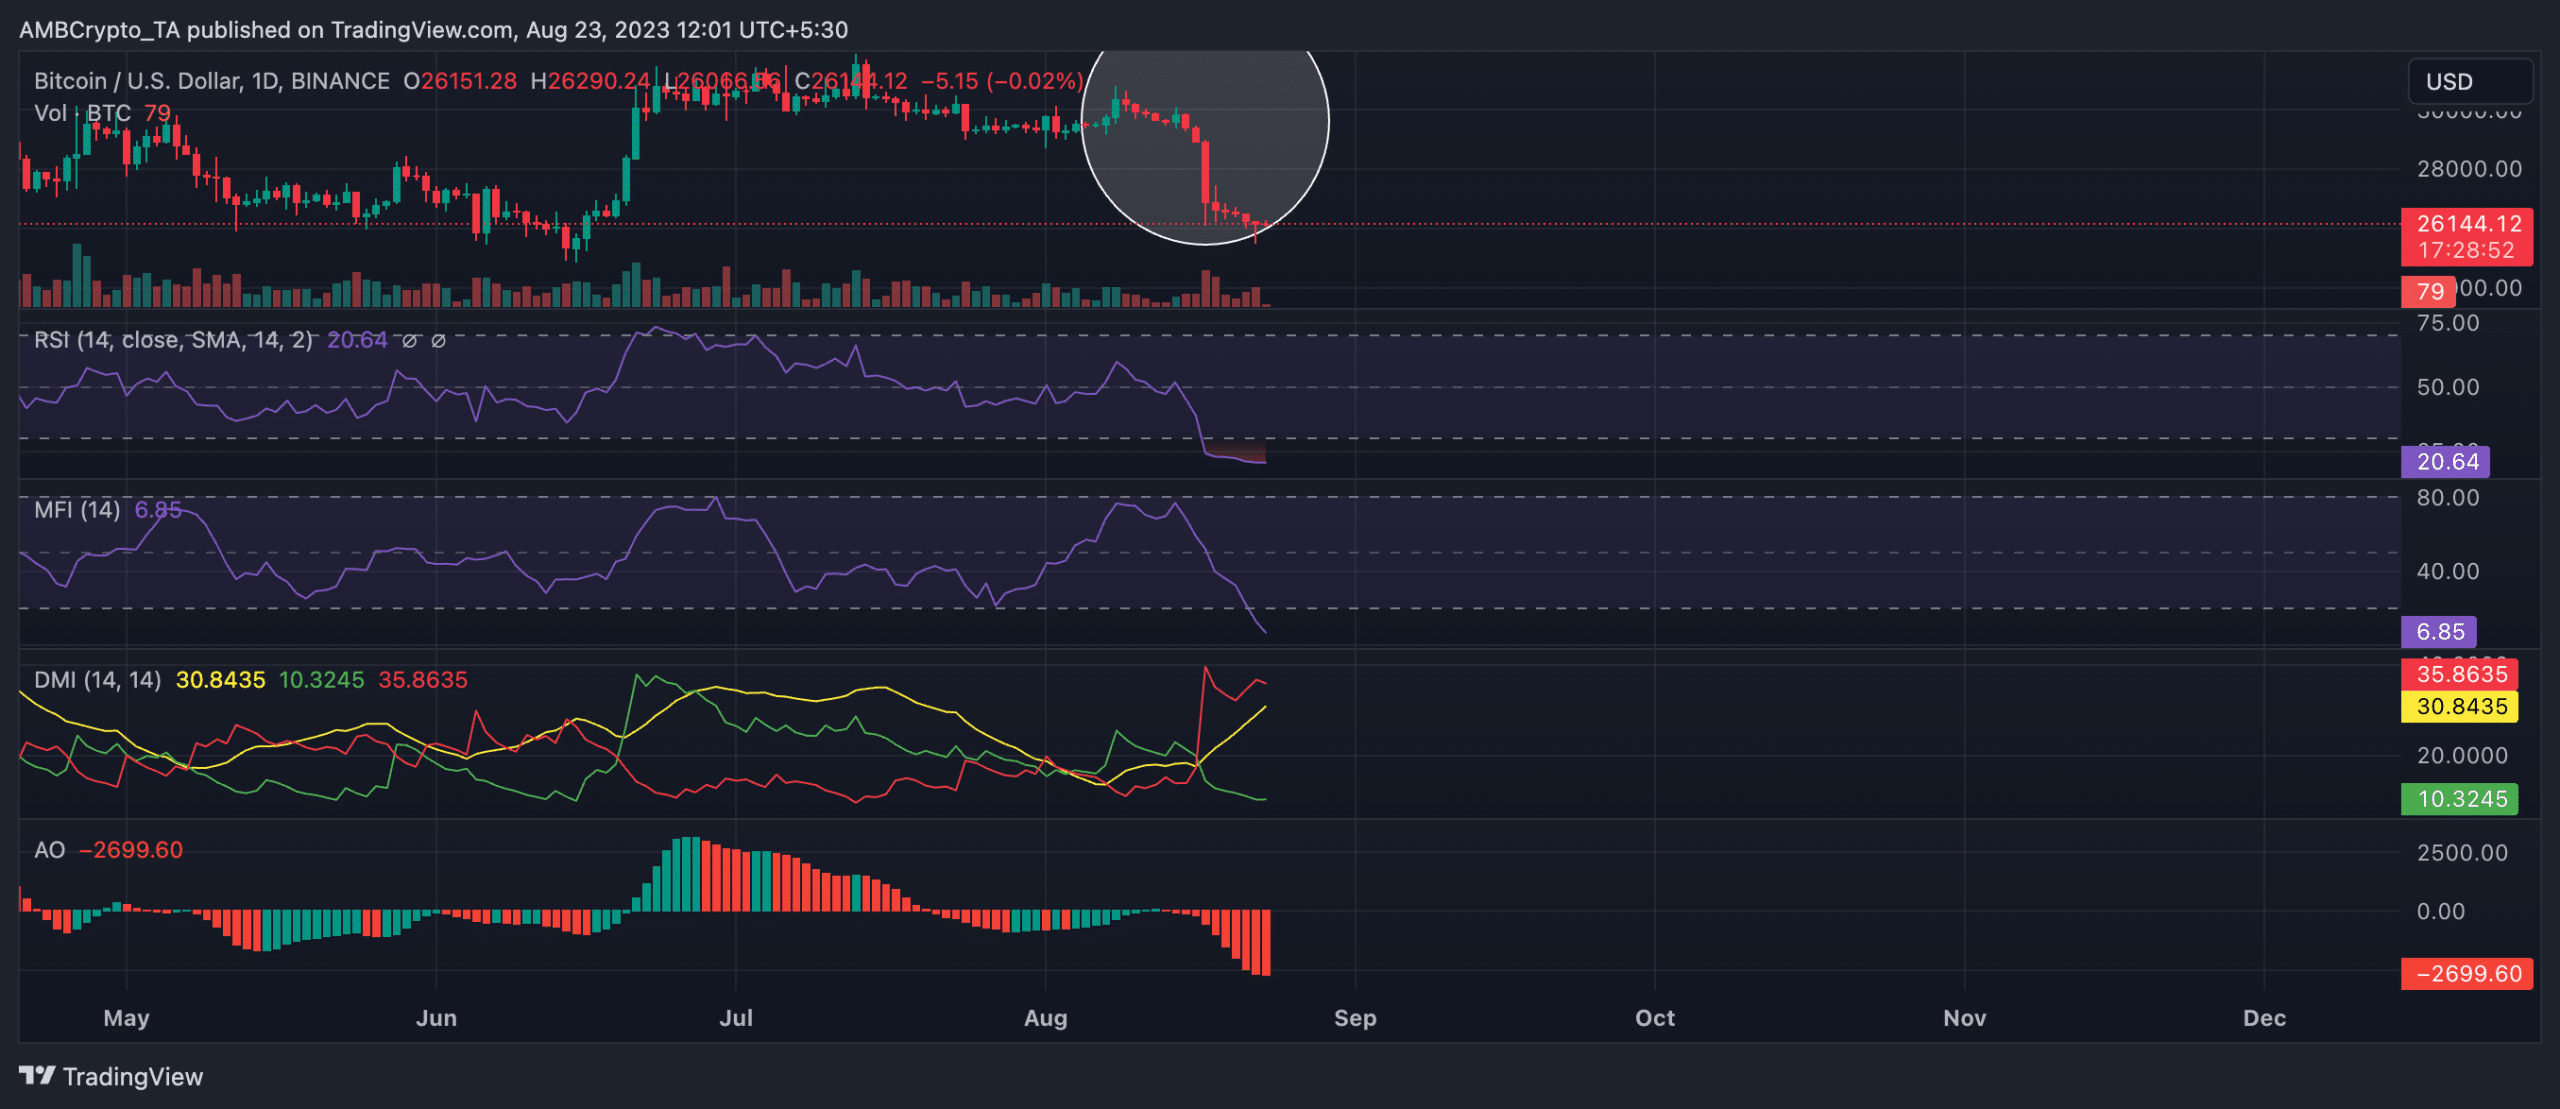
An assessment of BTC’s price movements on a daily chart revealed that its key momentum indicators have dropped to lows last seen in 2020.
Bitcoin daily RSI is the most oversold that it's been since the March 2020 covid crash pic.twitter.com/MPUfmQagcu
— Will (@WClemente) August 22, 2023
BTC’s Relative Strength Index (RSI) was pegged at 20.90, while its Money Flow had plummeted to 6.79 at the time of writing. The positions of these indicators confirmed the high volume of BTC sell-offs amongst daily traders, most of which happened after last week’s sudden price decline.
Since 17 August, BTC bears have been in control of the market. A look at the Directional Movement Index (DMI) showed the positive directional index (green) at 10.32, lingering below the negative directional index (red), which was 35.86.
In situations such as this, the downward movements are more pronounced than the upward movements, which points to a price downtrend.
Also signaling a waning buying pressure, BTC’s Awesome Oscillator has been marked by downward-facing red histogram bars since last week.
Is your portfolio green? Check the BTC Profit Calculator
Despite increased coin distribution amongst daily traders, players in the futures market have adopted a different approach. After a few days of shorting the leading coin, funding rates across crypto exchanges have turned positive.
This showed that investors have begun to occupy trading positions with bets placed in support of a rally in BTC’s price.