Bitcoin: Signs of bull run emerge, but all’s not well with BTC
Bitcoin’s Puell Multiple hints at a potential rally, but poor market sentiments suggest otherwise.

- BTC’s daily Puell Multiple attempted to cross above its 365-day moving average.
- Historically, this has preceded a jump in BTC’s value.
Bitcoin’s [BTC] daily Puell Multiple is poised to cross above its 365-day moving average, suggesting a potential for an upward rally, data from CryptoQuant has shown.
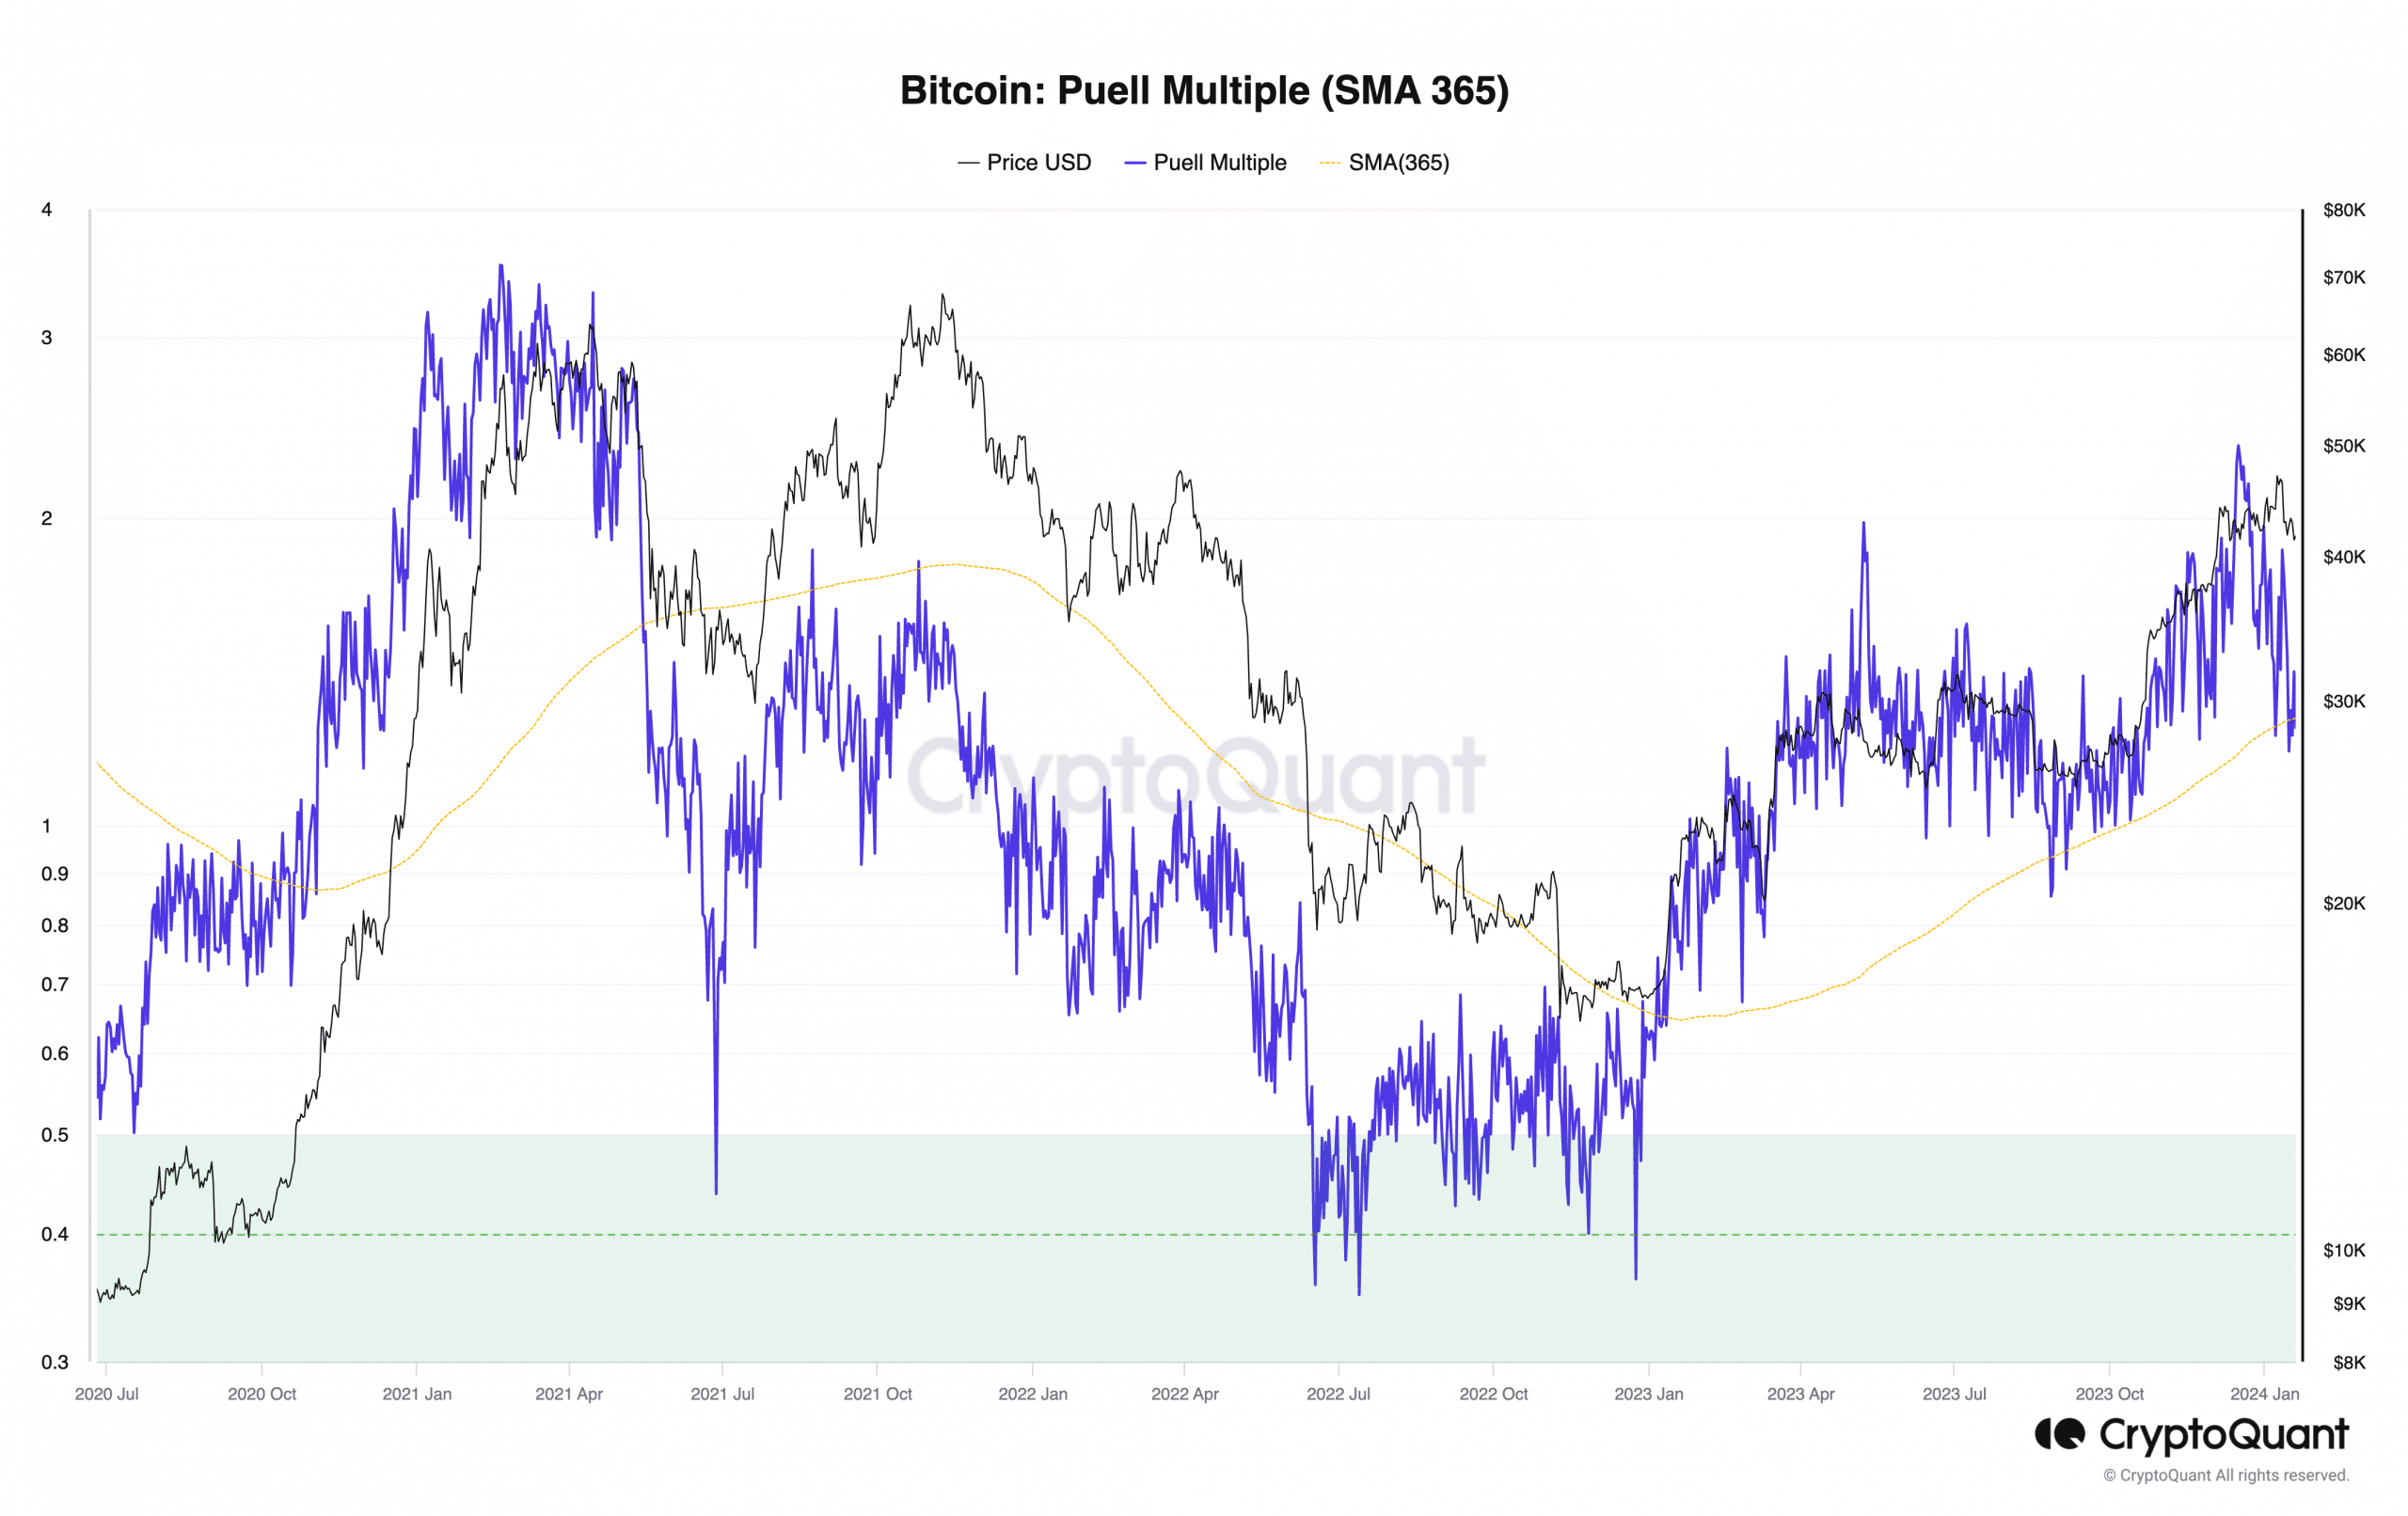
BTC’s Puell Multiple measures the ratio of measures the ratio of BTC mined daily to the 365-day average price.
When it returns a high value (above 4), miners are raking in profits above their typical costs, potentially leading them to sell off some of their holdings, putting downward pressure on the price.
Conversely, a low Puell Multiple (below 0.5) signals miners are struggling with low profit and are more inclined to hold onto their coins to avoid taking a loss.
In a new report, the chart provided by pseudonymous CryptoQuant analyst DataScope showed that, historically, a crossover of the daily Puell Multiple above the 365-day moving average has often been followed by periods of BTC price appreciation.
According to the analyst:
“The relationship between the daily Puell Multiple values and the 365-day Puell Multiple moving average can indicate market trends, with a daily Puell Multiple crossing above the 365-day moving average often indicating an upward price trend.”
No rally in view in the short term
While many predicted a rally above $50,000 post-ETF approval, BTC peaked at $48,625 on the 11th of January and has since trended downward.
Exchanging hands at $40,918 at press time, the leading coin’s value has plummeted by 16% in the last ten days, according to data from CoinMarketCap.
Also, the impending crossover of BTC’s daily Puell Multiple above the 365-day moving average suggested the possibility of a rally.
However, the low trade volume experienced in the last week indicated that this may not be possible in the short term.
An assessment of the coin’s daily trading volume on a seven-day moving average showed that it has declined by 35% since the 14th of January.
Data from Santiment revealed that the low trading activity might be due to the negative weighted sentiment that has trailed the coin since ETF went live.
Returning a negative value at press time, BTC’s Weighted Sentiment was -0.494.
Further, readings from the coin’s daily price chart showed that it had remained in a bear cycle since the 12th of January, when its MACD line crossed below the trend line to return negative values.

Read Bitcoin’s [BTC] Price Prediction 2024-25
When an asset’s MACD line intersects its trend line and falls below the zero line, it indicates that the short-term moving average has crossed below the long-term moving average, suggesting that downward momentum is stronger than any uptrend.
Traders often interpret this as a sell signal, putting downward pressure on an asset’s price. Therefore, any potential price uptrend may be delayed until sentiment improves and the bulls attempt to regain market control.


