
The altcoin market as expected continues to be fairly correlated to Bitcoin. Earlier in the week, when BTC’s price dropped, many of the market’s altcoins too saw a price drop. In the past few days, while some coins have begun their recovery run, some coins are still struggling to find their footing.
Bitcoin SV [BSV]
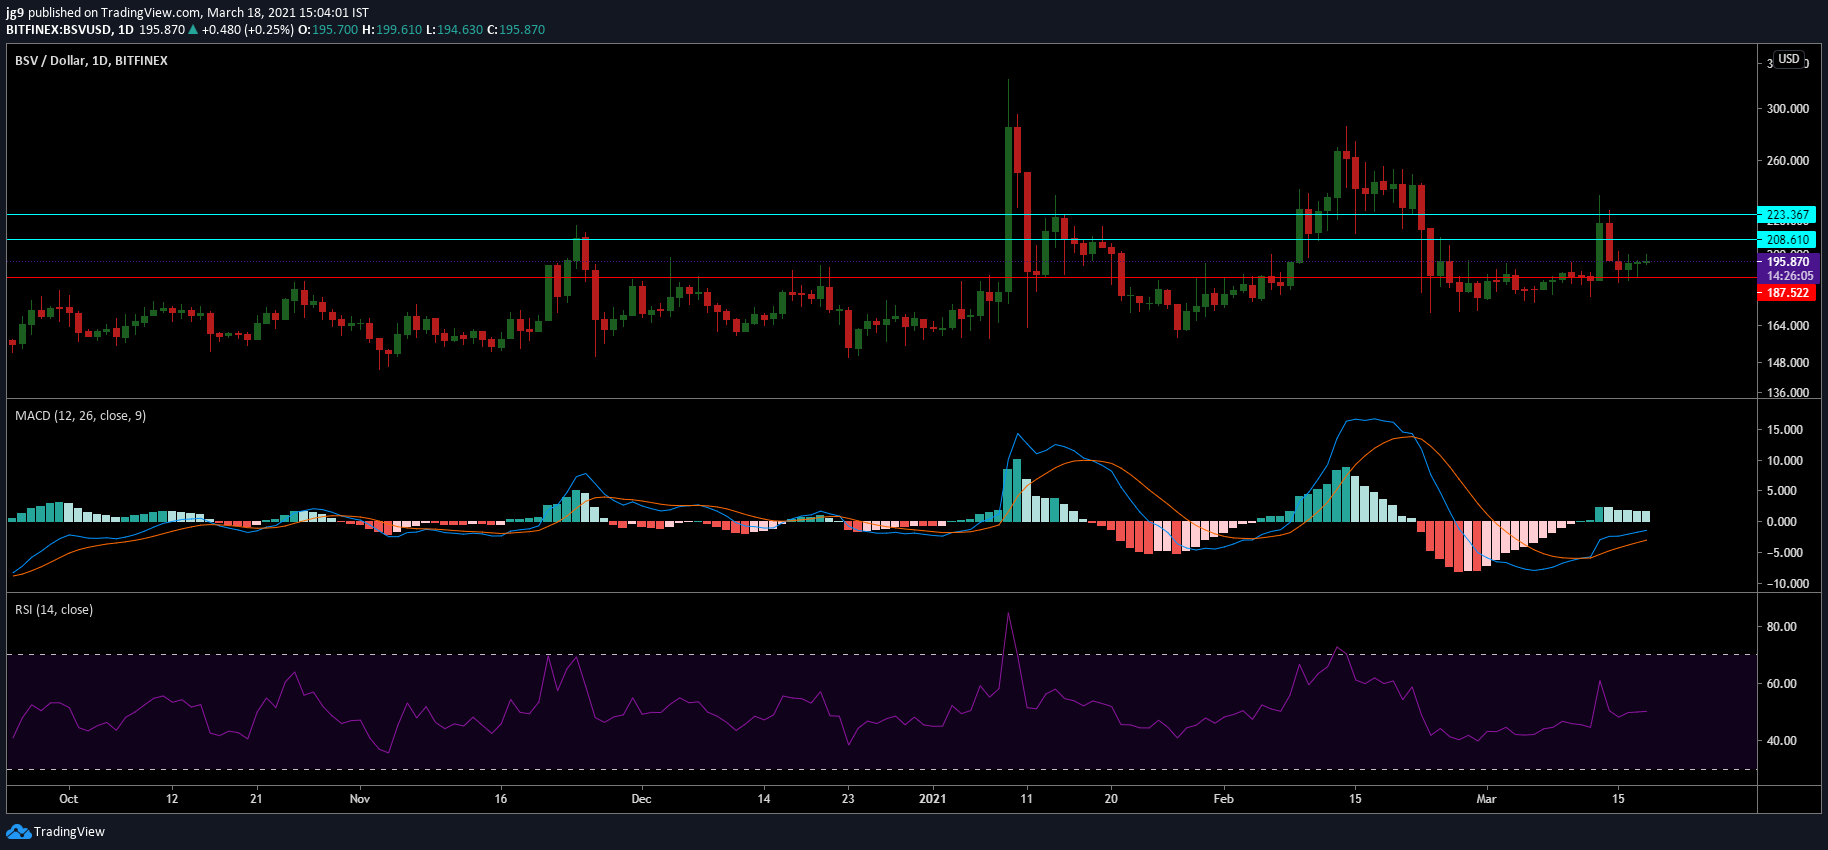
Source: BSV/USD, TradingView
Bitcoin SV endured a significant price slump a few days back and is currently trading at $195 with a market cap of over $3.6 billion. During the course of the past week, the coin has been able to only register a 3 percent hike on the charts. At the time of writing BSV is trading close to its support at $187 as it attempts to head closer to the formidable resistance around the $208-$223 price range.
The technical indicators for the coin currently look promising. The MACD indicator has undergone a bullish crossover and signals a price rise for the coin. The RSI indicator concurs as it continues to head closer to the overbought zone.
NEM [XEM]
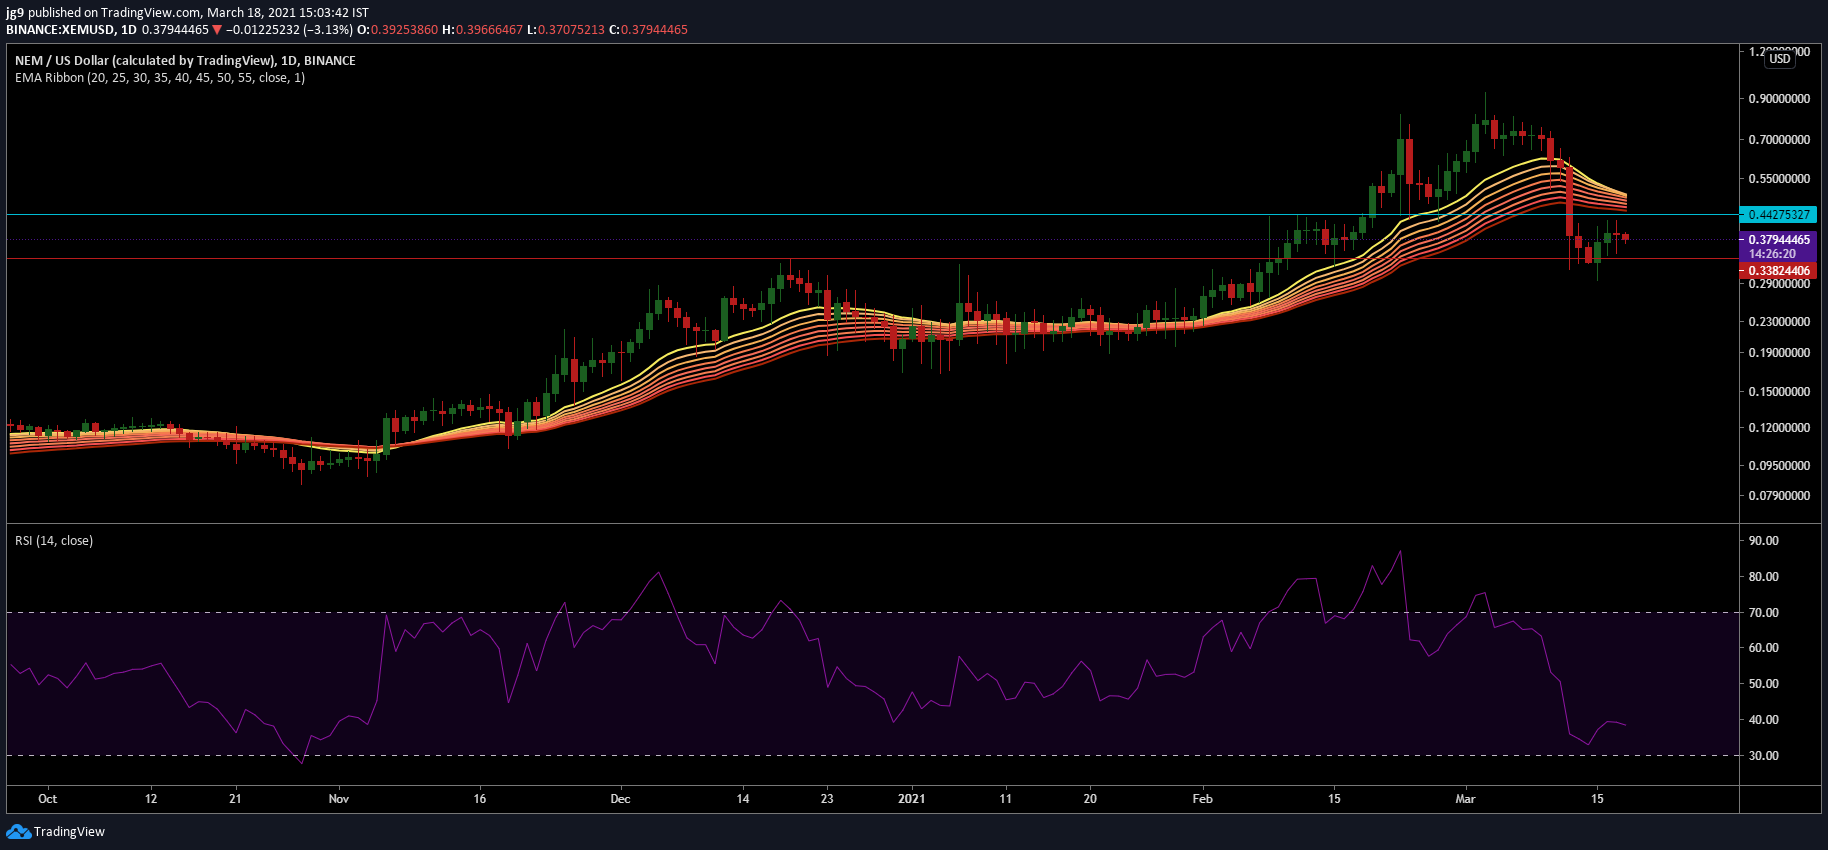
Source: XEM/USD, TradingView
NEM currently occupies the 32nd spot on CoinMarketCap’s list and currently trades at around $0.377. The coin has registered a market capitalization of around $3.4 billion and saw its price drop by over 34 percent in the past week. After enduring this massive price drop, NEM is currently on a recovery run but has to endure significant bearish pressure as it heads towards its resistance level at $0.44. If the coin is unable to breach this level the coin may require the help of its immediate support at $0.33 to stabilize its price.
The EMA ribbons have settled above the $0.44 resistance level and is likely to oppose the climbing price. The RSI indicator looks bearish as it has now fallen well into the oversold zone.
DigiByte [DGB]
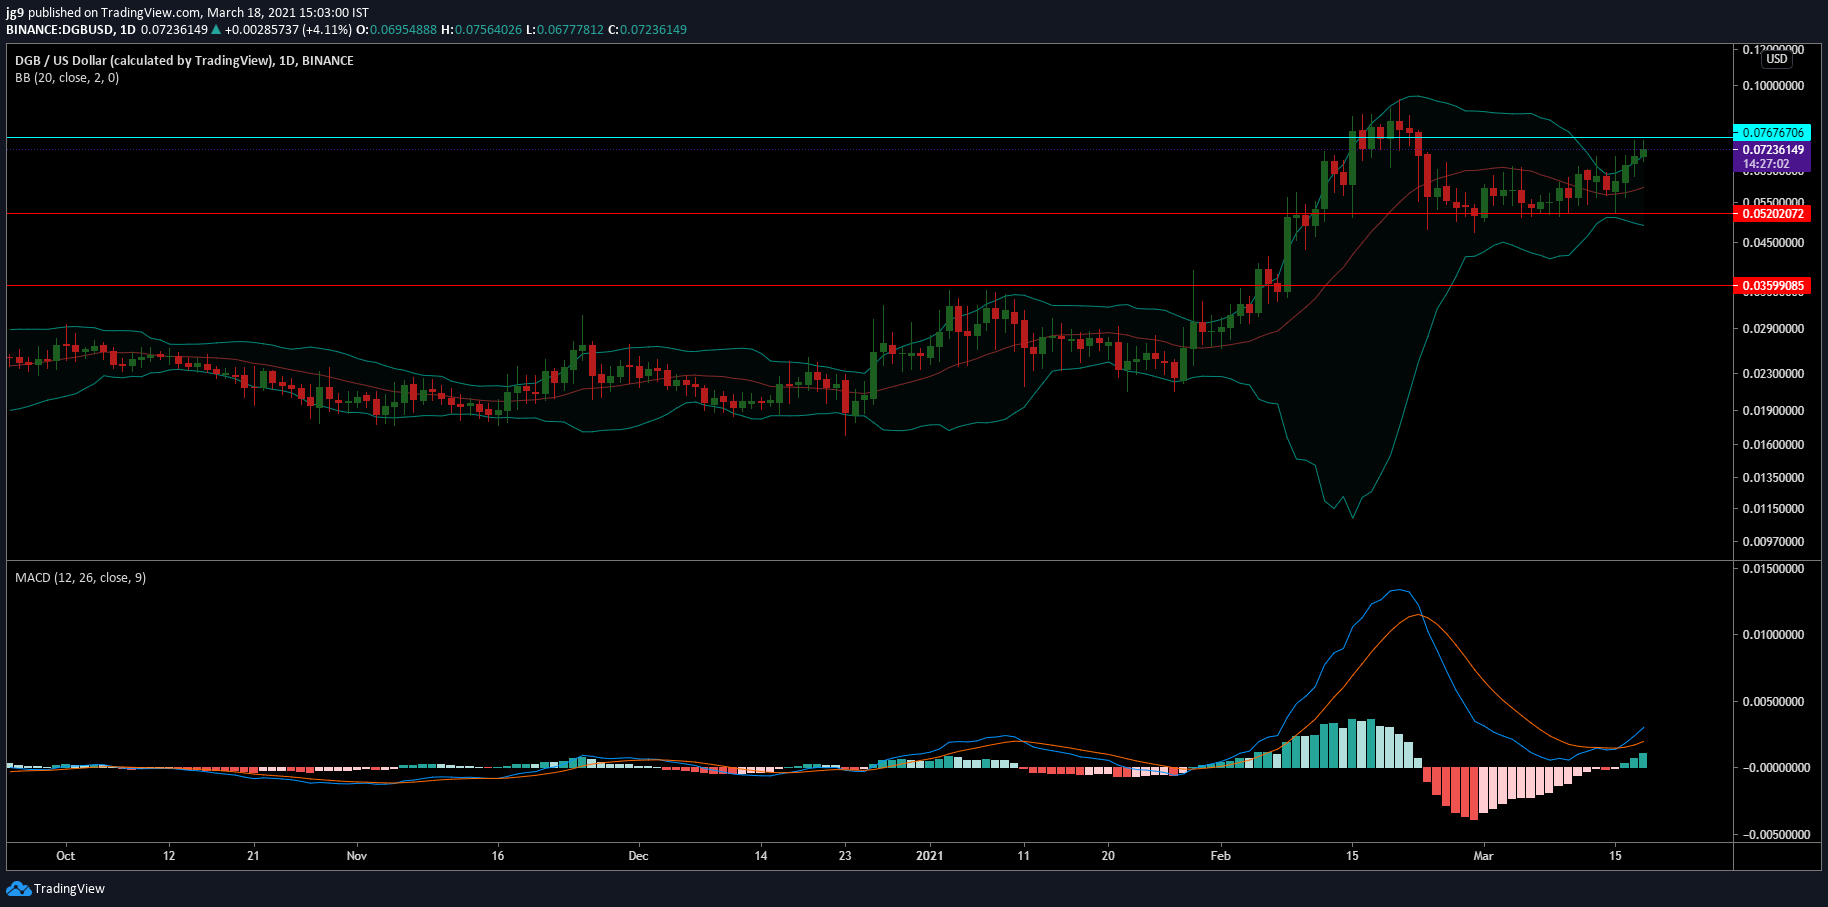
Source: DGB/USD, TradingView
Unlike the previous two coins, the market has been quite bullish in the case of DigiByte. In the past 7-days, the coin surged by around 27 percent and currently trades at $0.072. The price has been climbing steadily in the past few days and is now testing the resistance at $0.076. If the attempted breach were to fail, the coin can take support at $0.052.
According to the coin’s technical indicators, the Bollinger Bands indicate gradually increasing volatility, as the bands are now diverging. The MACD indicator also looks promising as it has undergone a bullish crossover and adds to the chances of the current resistance level being breached.