Bitcoin SV Price Analysis: 14 December

Disclaimer: The findings of the following article are the sole opinion of the writer and should not be taken as investment advice
For most of 2020, Bitcoin SV’s price movement has been contained within the resistance level of $235 and the support level at $150. While the trend has appeared both bullish and bearish, the latest long-term analysis would suggest that over the past few months, the inclination towards a stronger bearish period has become more rigid.
Bitcoin 1-day chart
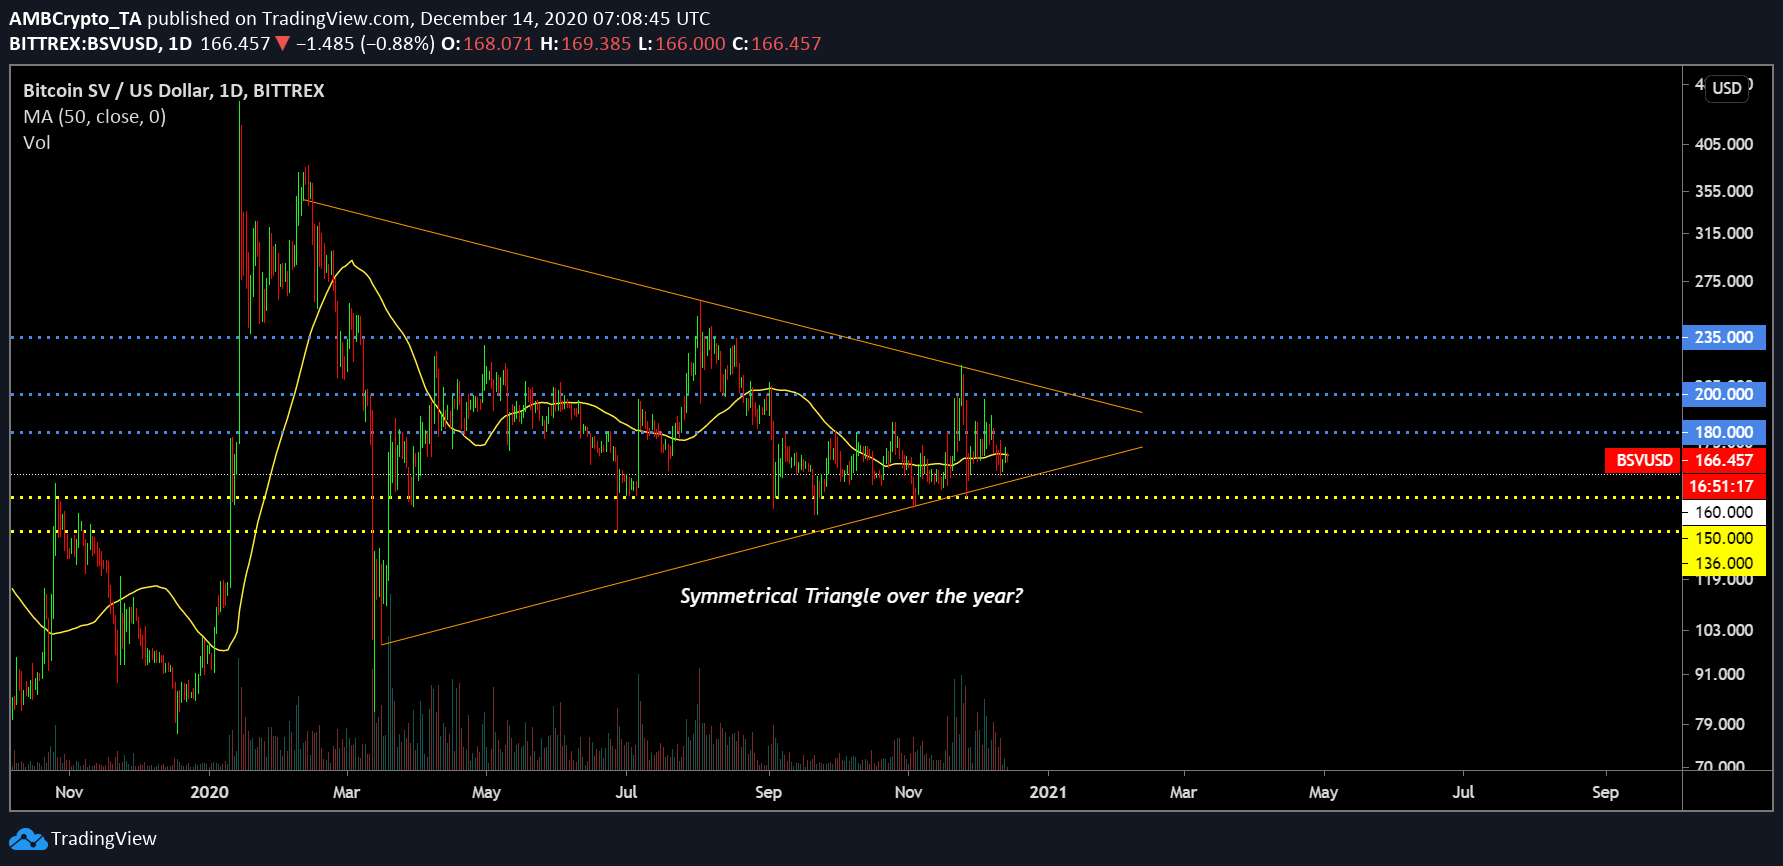
The 1-day chart for Bitcoin SV was an example of sideways volatility into restricted tunneling. Since late July, the cryptocurrency’s valuation has recorded a couple of bullish and bearish trends, but the symmetrical triangle pattern has not been breached. Now, over the last few weeks, the valuation has been confined below the $200-resistance level, and over the next couple of months, the pattern should undergo a breach.
While a symmetrical triangle carries both bullish and bearish implications, the trend seemed to be inclining towards a drop. Here’s why,
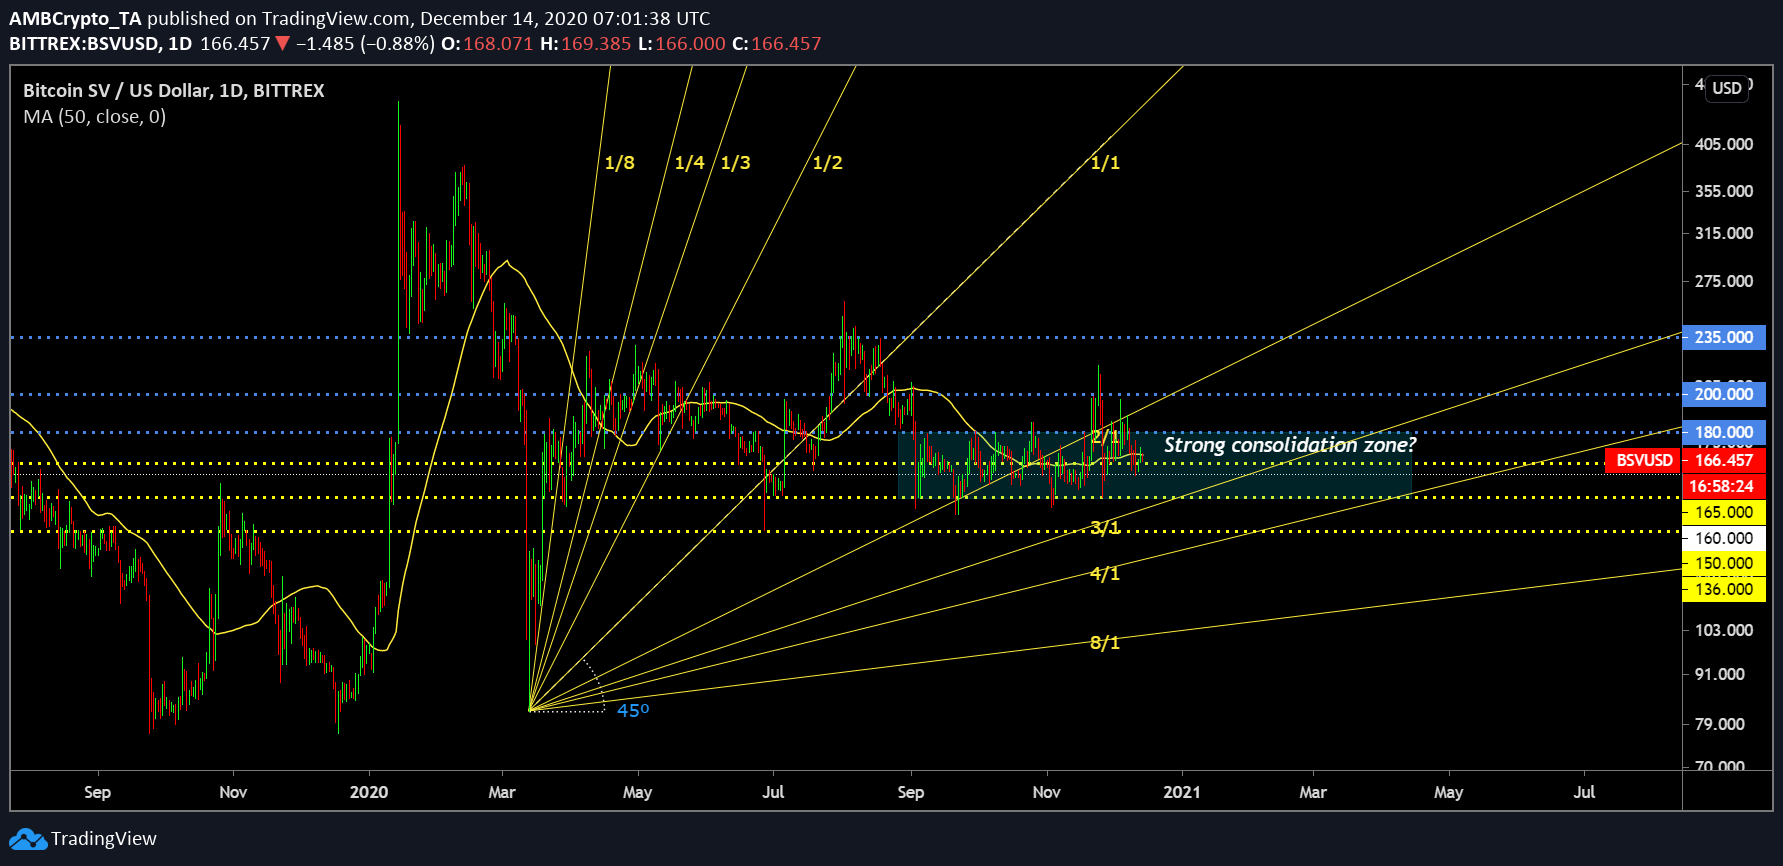
As observed in the attached chart, the Gann fan indicator was suggesting that the valuation of BSV was falling under the 2:1 support line as well. The trend continued to fade into the bearish territory as the valuation went on to move away from the 1:1 line. The 50-Moving Average, at the time of writing, was neutral, with the price becoming a little less volatile on the charts.
Market Reasoning
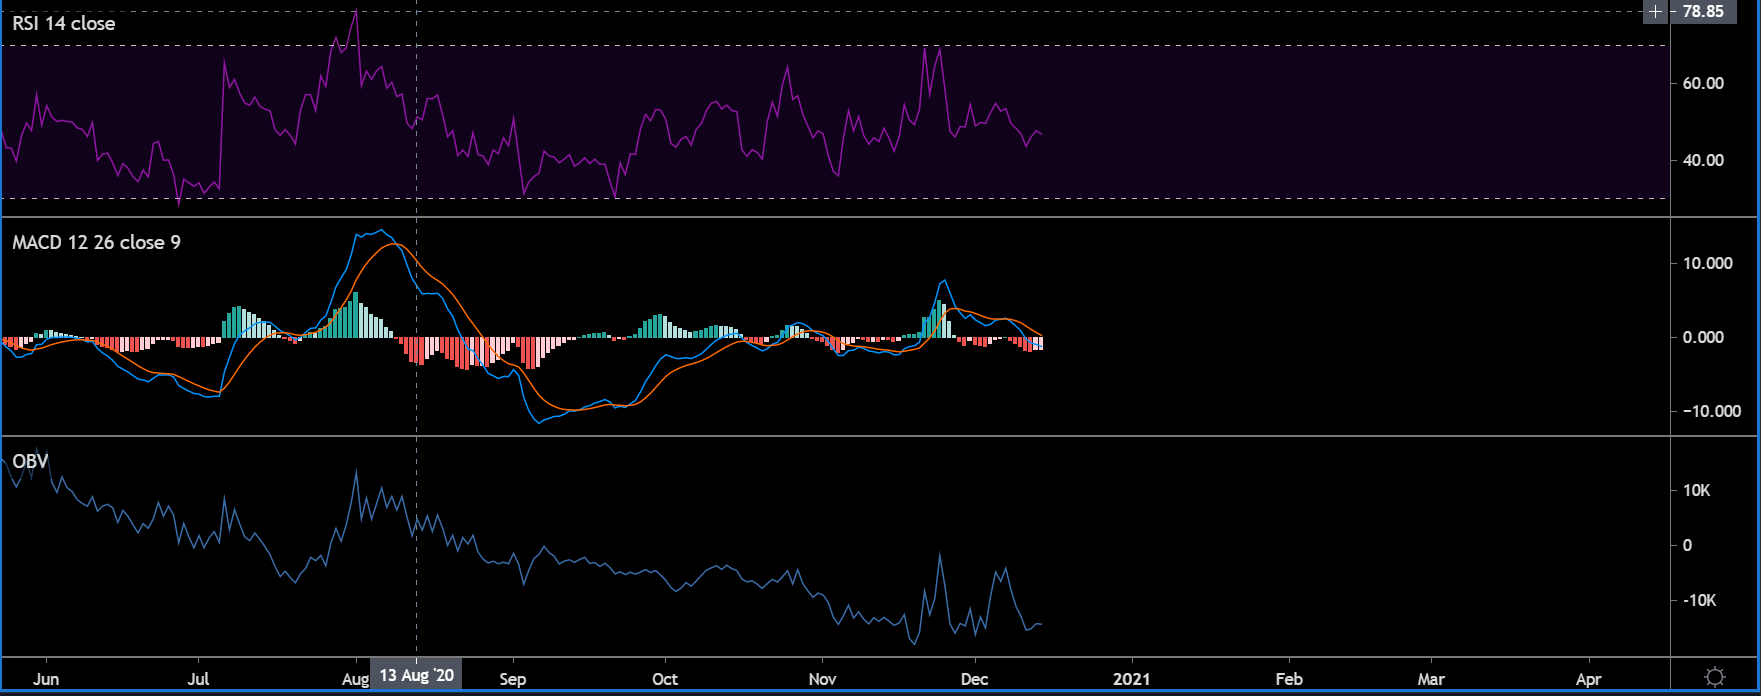
At the time of writing, market indicators were exhibiting a mix of neutral and bearish trends. The MACD was completely bearish, with the blue line hovering over the orange line on the charts. Further, the On-balance volume was suggestive of a low range which pushed buyers completely out of the picture, at press time.
Finally, the Relative Strength Index or RSI was temporarily neutral, but the indicator had flipped towards the bottom, suggesting an increase in selling pressure.
Important Range
Resistance: $235, $200, $180, $174
Support: $165, $160 $160, $136
Conclusion
With Bitcoin SV, it is difficult to outlay a proper long-term scenario. Its dependency on the rest of the market remains high and the market was under a consolidation phase, at press time. However, on its own, Bitcoin SV seemed to be heading towards a long-term period of correction.


