Bitcoin SV, SUSHI, FTX Token Price Analysis: 19 March

The altcoin market seemed to have arrested the bearishness that was prevalent a few days ago, at press time. While for coins like Bitcoin SV, SUSHI, and FTX Token, there wasn’t drastic bullish momentum on the charts, the prices seem did recover well. In fact, in the cases of SUSHI and FTT, the charts showed sustained consolidation.
Bitcoin SV [BSV]

Source: BSV/USD, TradingView
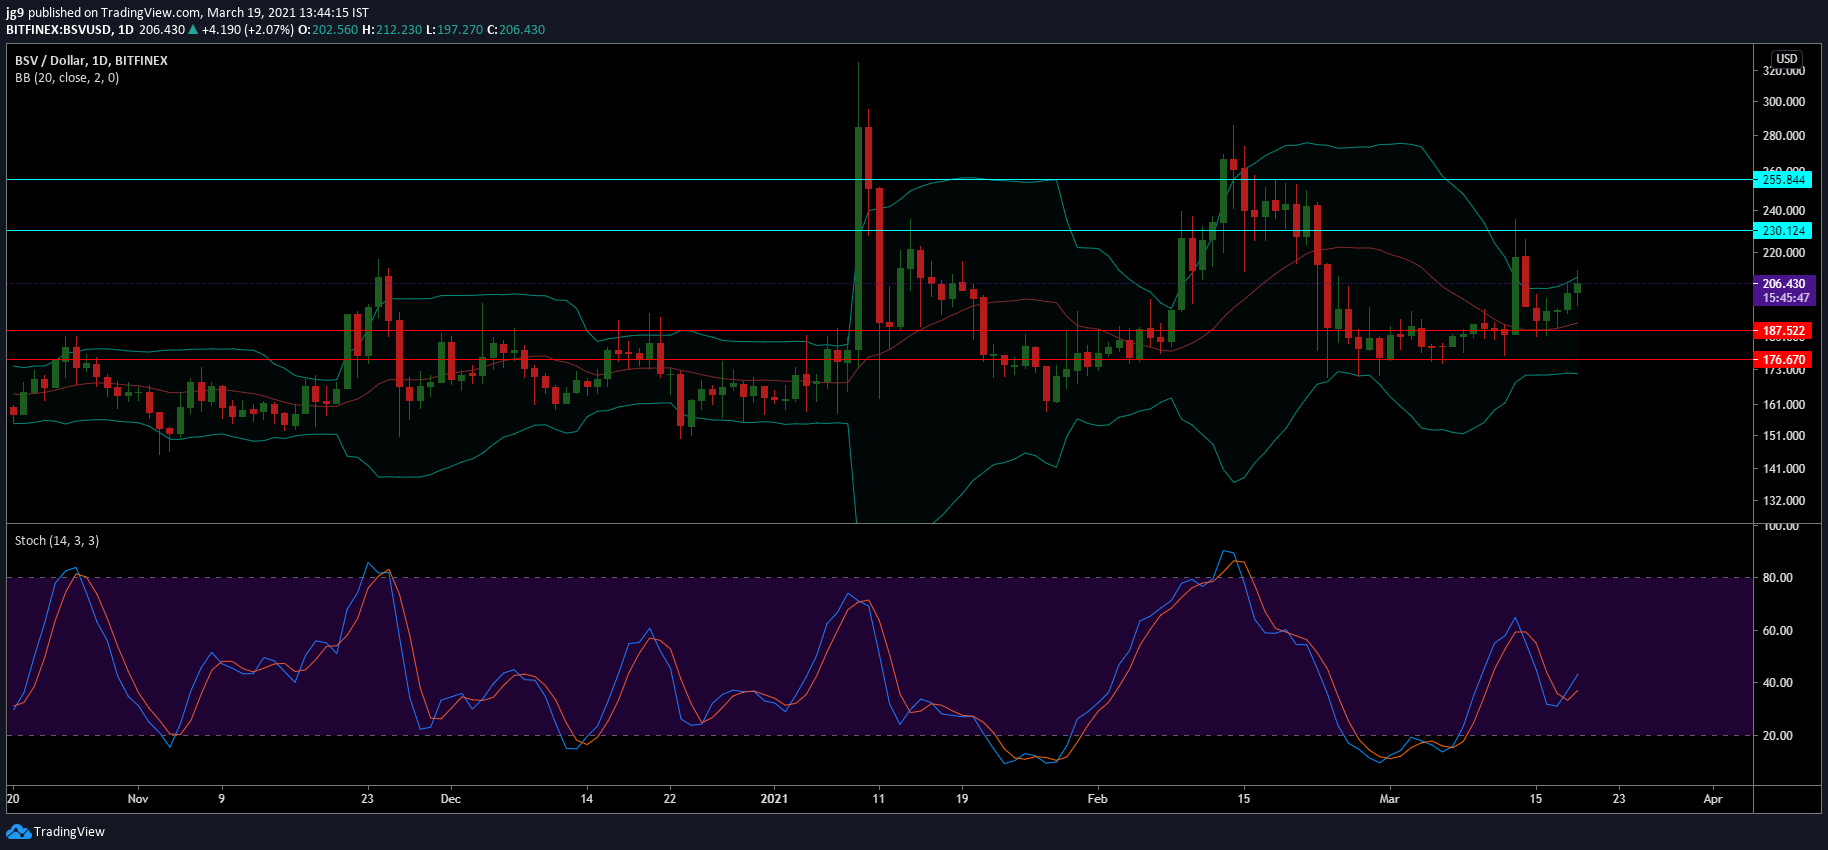
Bitcoin SV saw its price hike by over 10 percent over the past week. This pushed BSV’s trading price to $206, with the crypto having a market cap of over $3.9 billion. After having endured a significant drop in price at the start of the week, BSV was recovering well and posted gains of over 4 percent in the last 24 hours alone.
The coin enjoyed a strong level of resistance around the $230 and $255 price range. However, in the case of a price correction, BSV can rely on the support levels at $187 and $176.
The Bollinger Bands for the coin had compressed significantly, with both underlining lower levels of volatility. The Stochastic indicator looked promising since it underwent a bullish crossover and was heading closer to the overbought zone.
SushiSwap [SUSHI]

Source: SUSHI/USD, TradingView
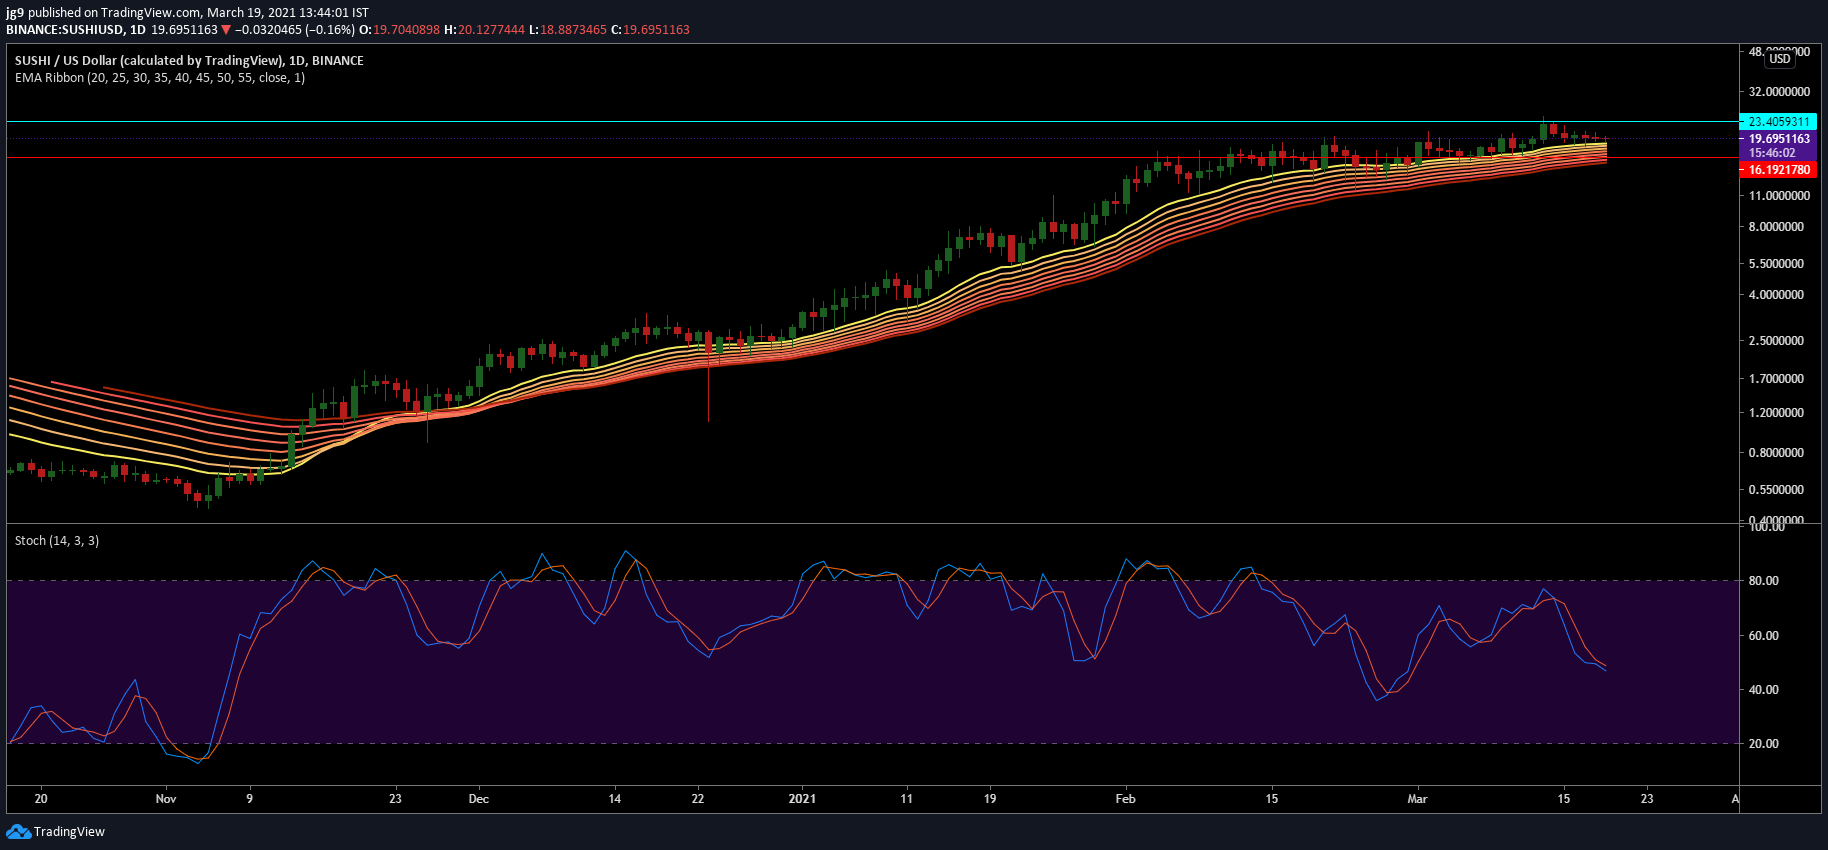
SushiSwap’s price was trading inside a tight range all through the past week. At press time, the altcoin was valued at $19.5, with the crypto close to the immediate resistance level around the $23.4 price range. SUSHI enjoyed a market cap of $2.4 billion, with its price noting a minor hike of 0.73 percent over the past week.
If SUSHI’s price fails to breach its resistance level, then the coin may head towards the support at $16.
The EMA Ribbons are likely to help SUSHI in case of a price correction as they had settled below the coin’s trading price and were well poised to offer support. Further, the Stochastic indicator was bearish since it was heading into the oversold zone.
FTX Token [FTT]

Source: FTT/USD, TradingView
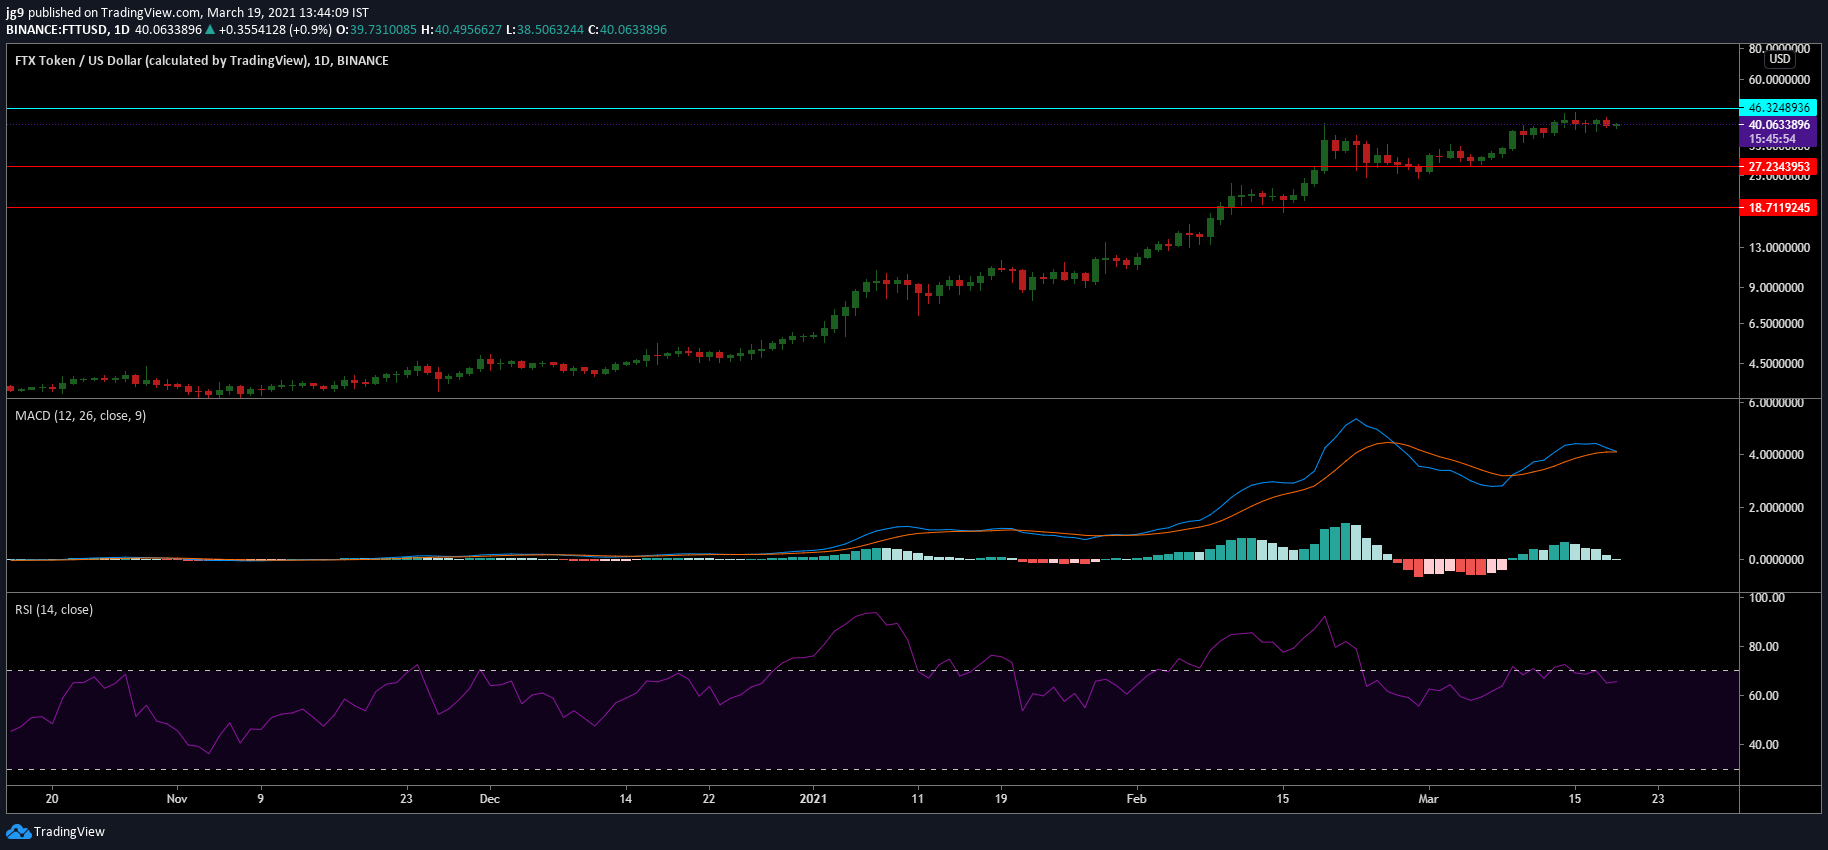
FTT saw its price rise on the charts during the start of the week. However, since then, the coin has had to deal with a bit of sideways movement. At the time of writing, FTT was being traded at $39.8 with a market capitalization of $3.7 billion. If the sideways movement were to transition to a downtrend as a result of the lackluster bullish momentum, then FTT will have to rely on the supports at $27 and $18.
The technical indicators painted a bearish picture for the token as the MACD indicator was about to undergo a bearish crossover while the RSI was slowly moving out of the overbought zone.


