Bitcoin: How this metric can save investors
The king coin's price has long-term potential of reaching its peak again. But it depends on a number of factors.

- BTC may have approached the beginning of a bullish run.
- The coin circulation rests in an extremely low region.
Bitcoin’s [BTC] failure to recover from its recent decline could be something that long-term investors may not necessarily need to worry about, based on signals from the Pi Cycle Top indicator.
Is your portfolio green? Check the Bitcoin Profit Calculator
Historically, the indicator has been instrumental in picking out market cycles. Furthermore, the metric uses the 111-day Moving Average (MA) and a multiple of the 350-day MA with respect to the Bitcoin Price.
Offering chances that lead to the pinnacle
According to LookIntoBitcoin, the 111-day MA was still lower than the 350-day MA. This implies that the current market was far from being overheated since Bitcoin peaks only happened when the former surpassed the latter.
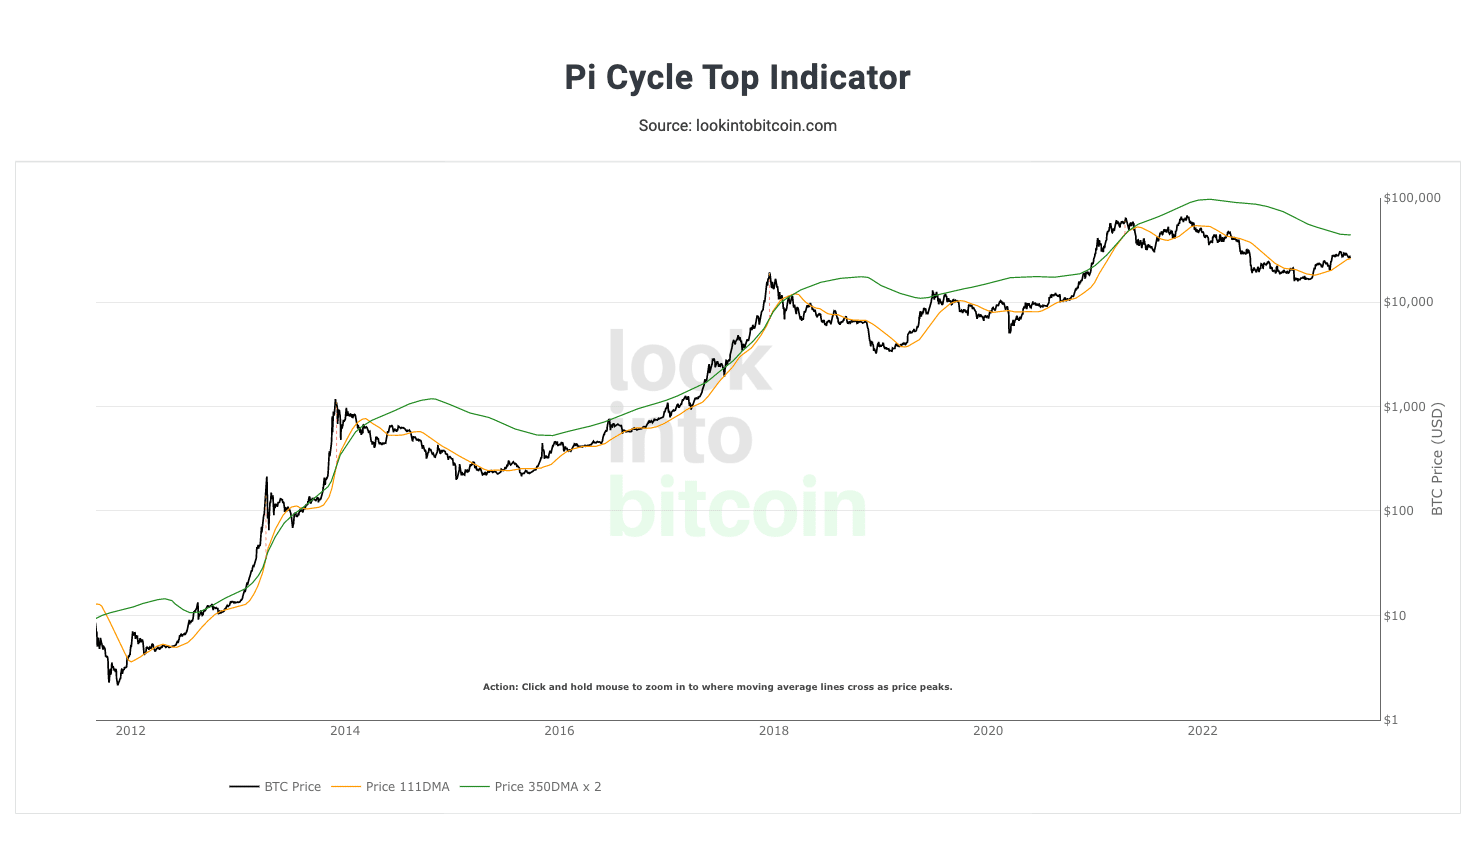
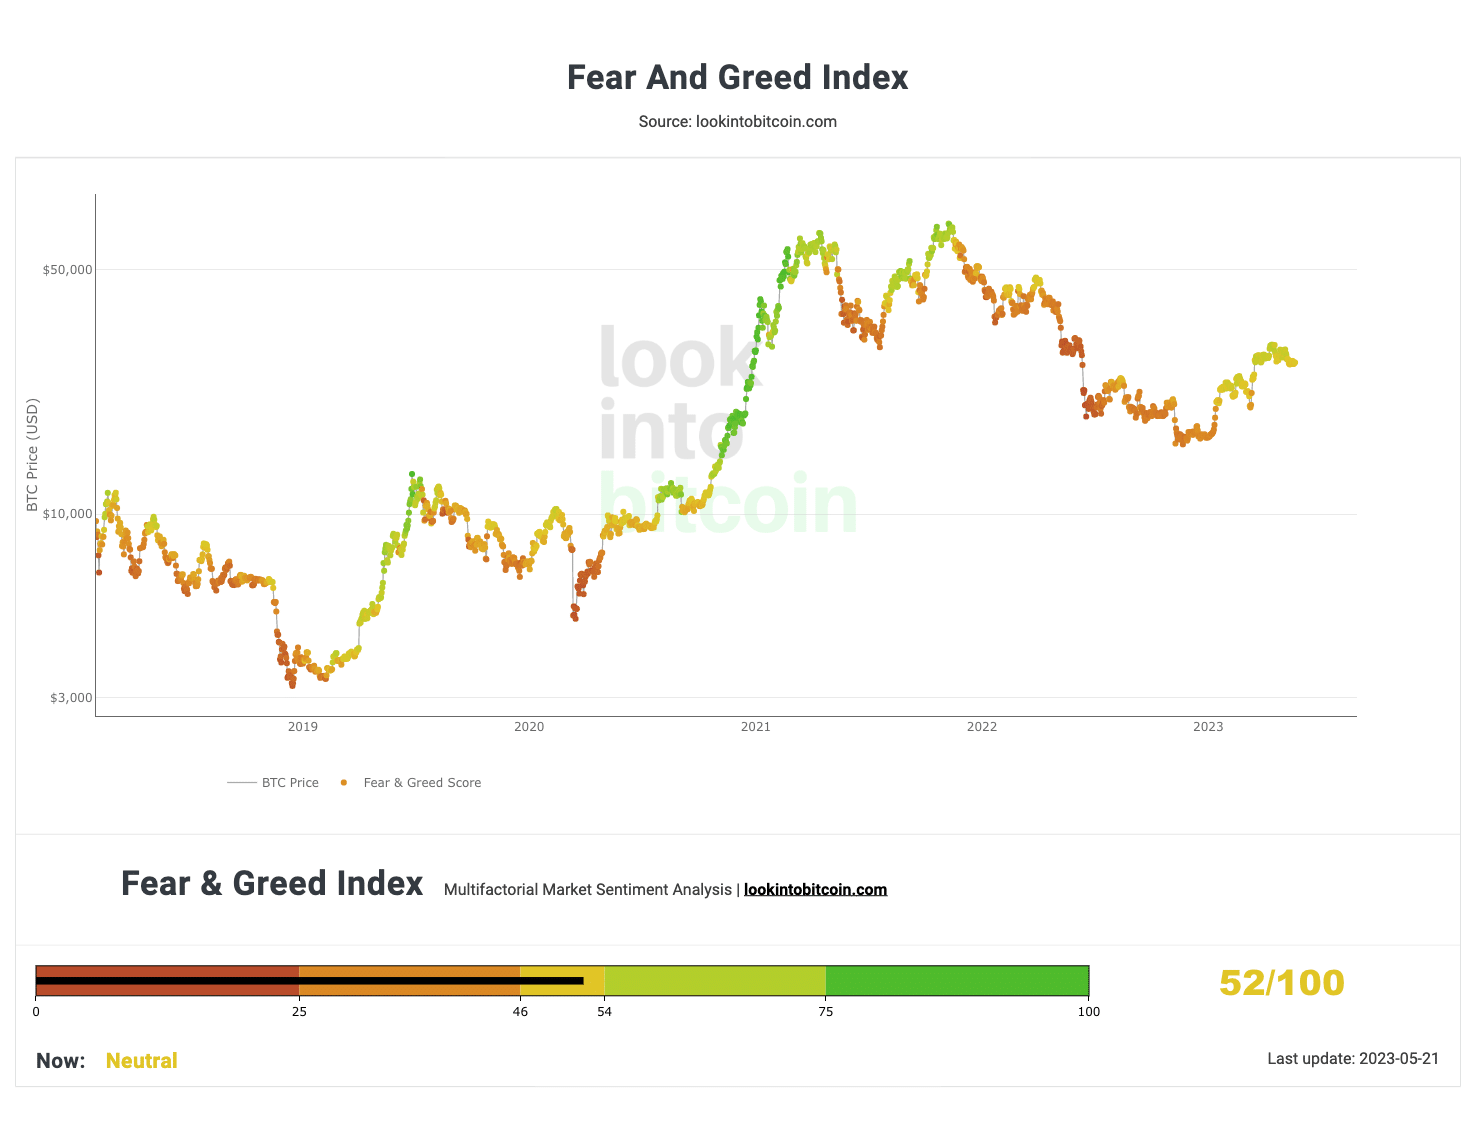
Therefore, it may seem advantageous to accumulate some BTC at the current state. Despite the hope that the Pi Cycle Top Indicator offers, the Bitcoin fear and greed index decreased to 48.
The index considers volatility, momentum, and market sentiment in determining participant reaction to sudden price action.
In the first quarter, this index pointed to the greed region. But now that it was neutral and closer to the fear area, it means that investors were not presently excited about the price prospect.
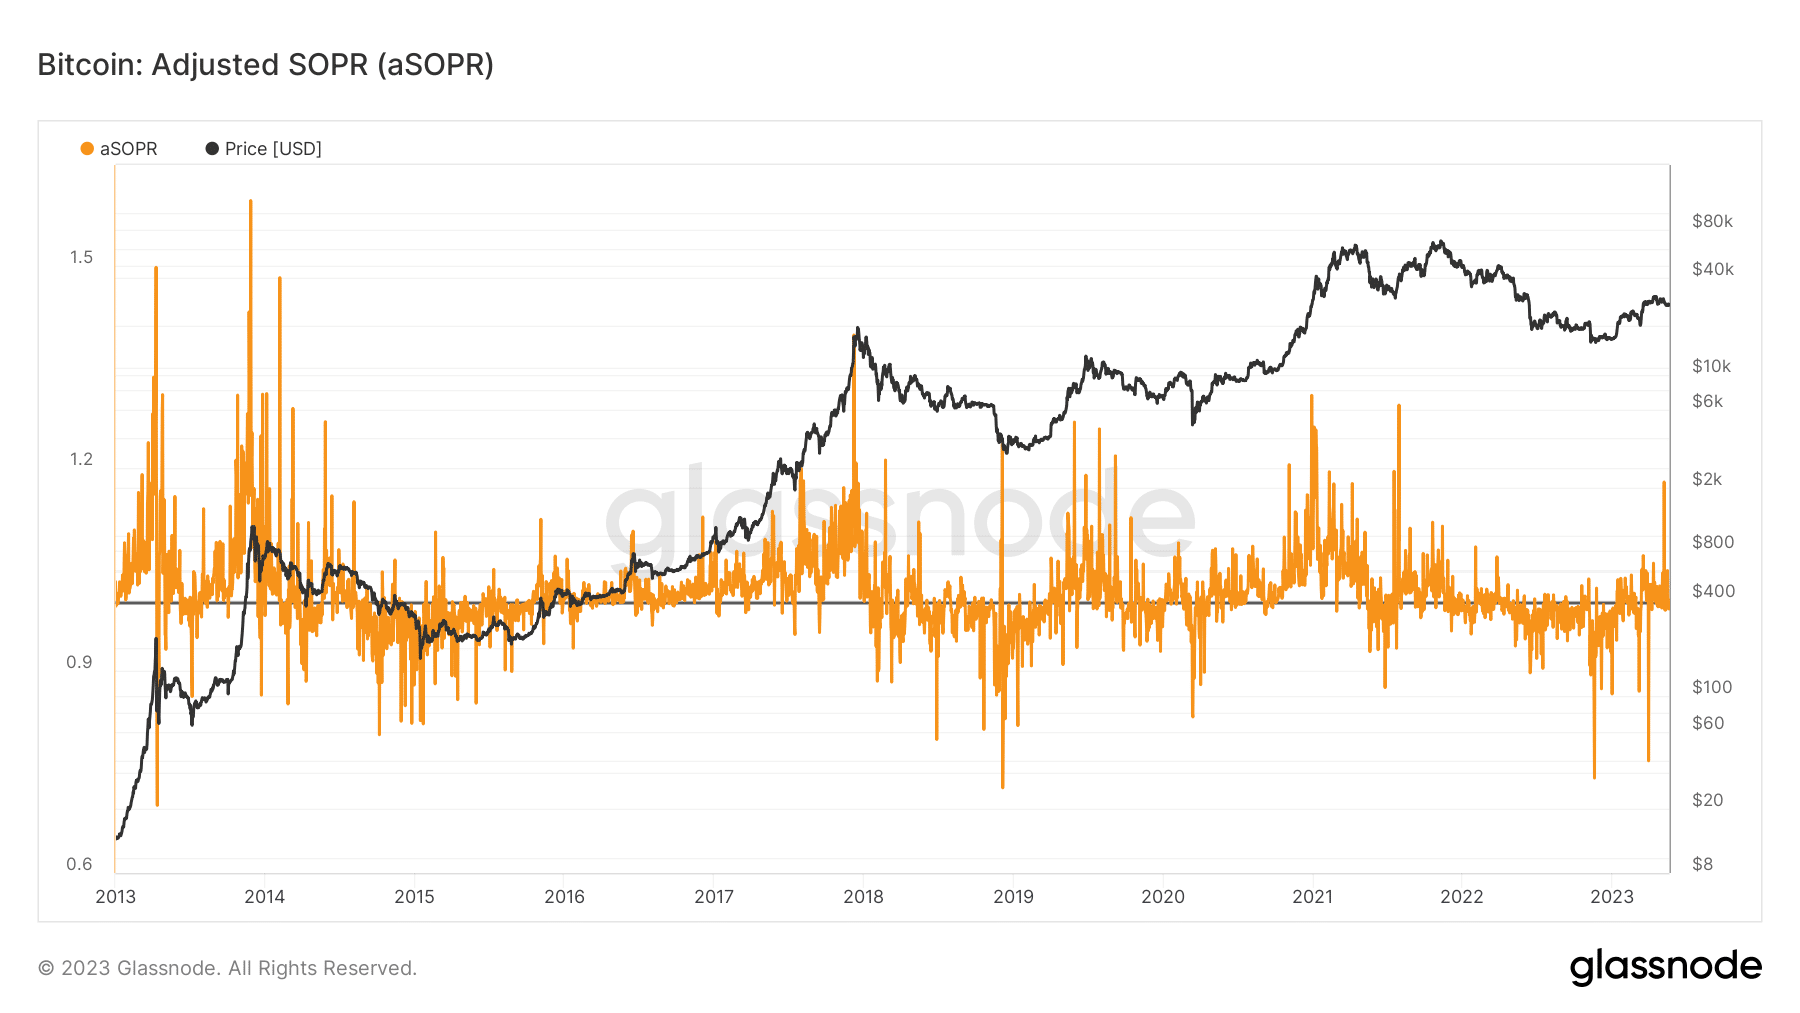
At press time, BTC’s price was $27,069, a mild 3.83% decrease in the last 30 days. In addressing network profitability, the adjusted Spent Output Profit Ratio (aSOPR) left the negative region.
The aSOPR reflects the shift in market sentiment of shrimps and whales’ lifespan while monitoring profitability. With its value above 1.0, the aSOPR showed that there has been a recovery around the 90-day Exponential Moving Average (EMA).
Therefore, this means that a wide cross-section of BTC holders leaned toward profitability.
Circulation down
Although the aSOPR and Pi Cycle Top indicators displayed bullish potential, BTC might require more input from investors than is currently experienced. For instance, the 365-day circulation had dropped to 5.61 million.
Realistic or not, here’s BTC’s market cap in ETH terms
Circulation shows the number of unique coins engaged in transactions within a specific period. As of January, circulation was as high as 6.05 million. Hence, the decline means that investors were shying away from exchanging BTC between addresses.
Meanwhile, the daily active addresses have revived from the severe decrease on 7 May. As of 20 May, the metric has moved to 737,000.
This meant that there was a considerable level of crowd depositing and receiving BTC based on the market. Thus, increasing the level of interaction with the coin.
![Bitcoin [BTC] circulation and daily active addresses](https://ambcrypto.com/wp-content/uploads/2023/05/Bitcoin-BTC-12.03.54-21-May-2023.png)