Bitcoin to $100K by October may not be too unrealistic if…

With Bitcoin bouncing off lower lows swiftly over the last weekend, looking at the spike in volumes on 26 July, Futures traders were in for a surprise. As the entire market became more active following the 25% weekly gains, the Options market highlighted some interesting trends.
Even though these unexpected price moves stirred up the market, they couldn’t push Bitcoin’s price enough to spur the derivatives market. The reason? Despite its recent bullishness, Bitcoin remained close below the $40k-mark.
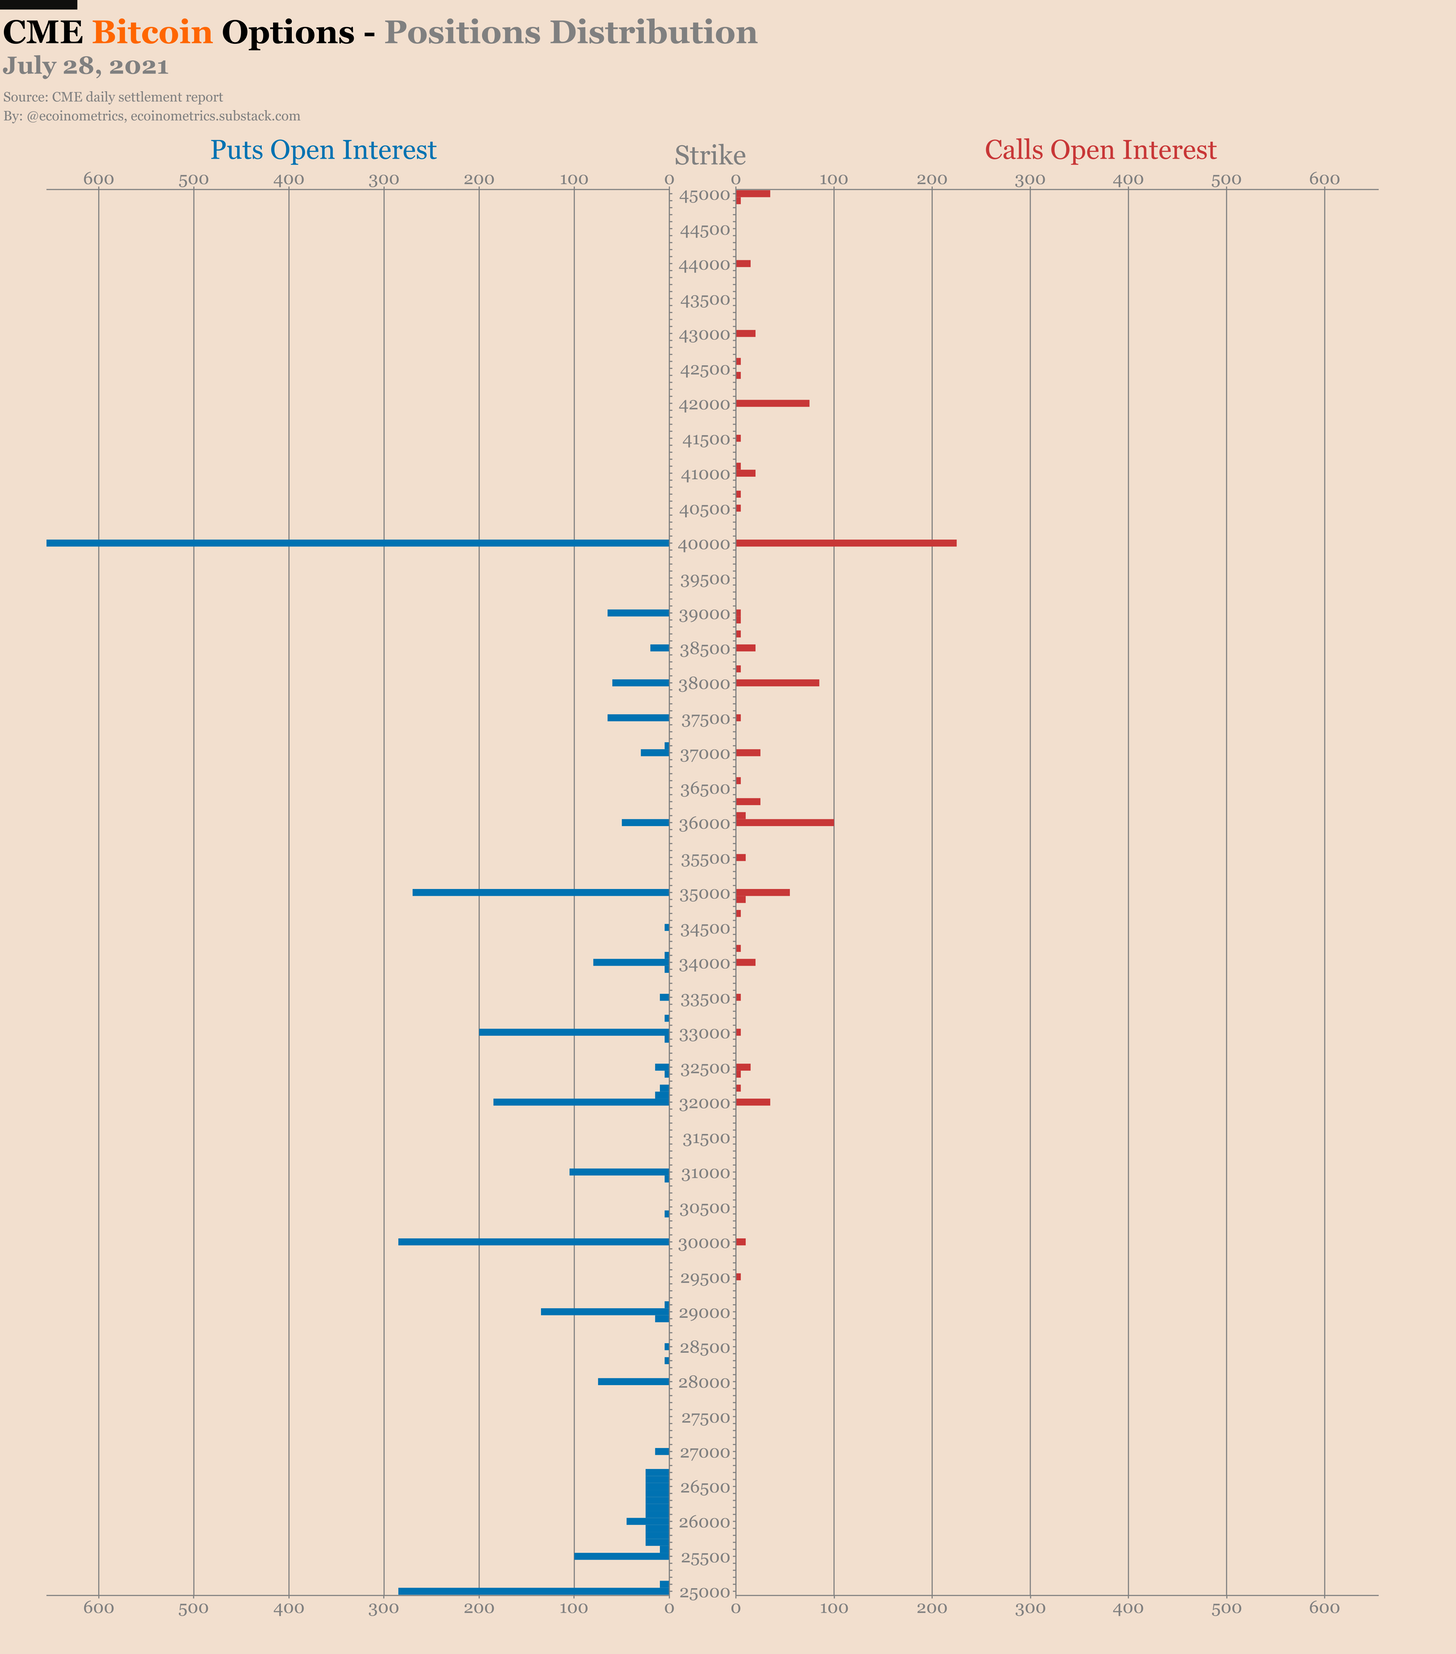
As much as most want to believe that this was a breakout, the crucial level of $42k is the one to look out for. The same was highlighted by a recent Ecoinometrics report.
“If you look at a price chart you’ll see that this (40K level) doesn’t count yet as a breakout. A real breakout would be a daily close above $42k which is pretty much the highest point BTC set in June after the crash.”
However, the Options market reveals a noticeable shift in sentiment too. Firstly, overall there were 7 puts for every 4 calls. This suggested that more traders are less worried about the downside. Also, a closer look at the contracts revealed that there are five puts for every two calls in July and one put for every call after that.
This means that the market is skewed towards puts for the July contract which, by the way, expires in a couple of days. After July, however, sentiment flowing back into neutral can be observed.
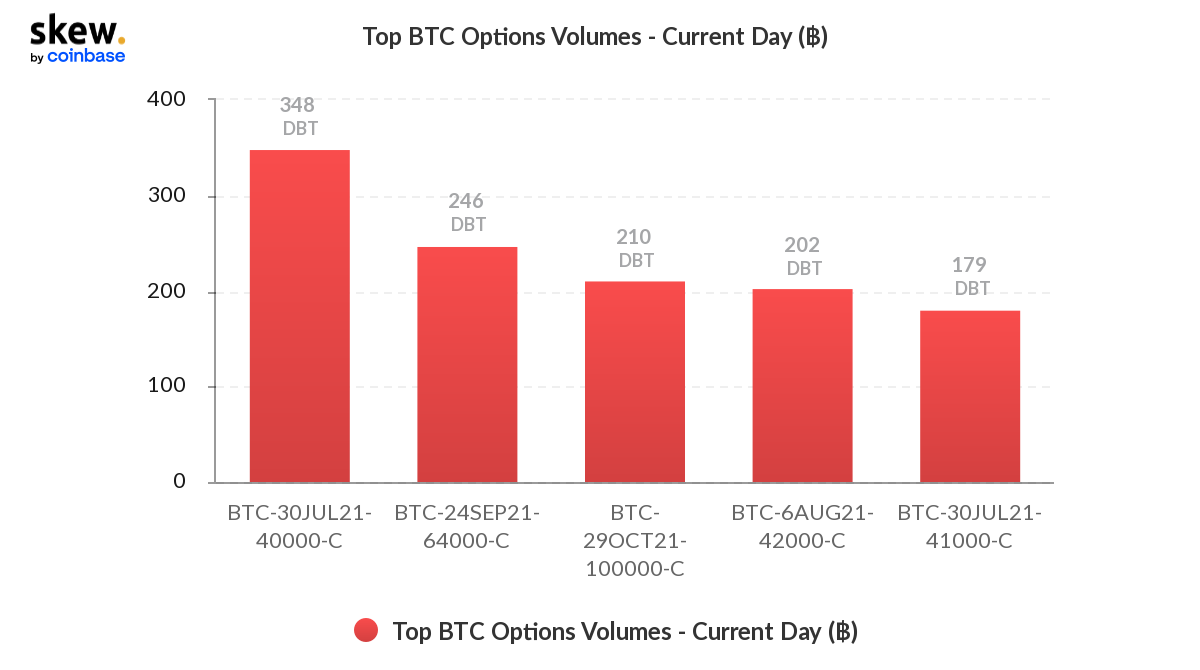
For 29 July, the eighth consecutive day of Bitcoin closing in the green on a one-day chart, BTC Options volume projected a bullish picture. The top five BTC Options volumes were calls. Interestingly, 210 DBT were calling the shots on Bitcoin’s price reaching $100k by October-end.

Source: Skew
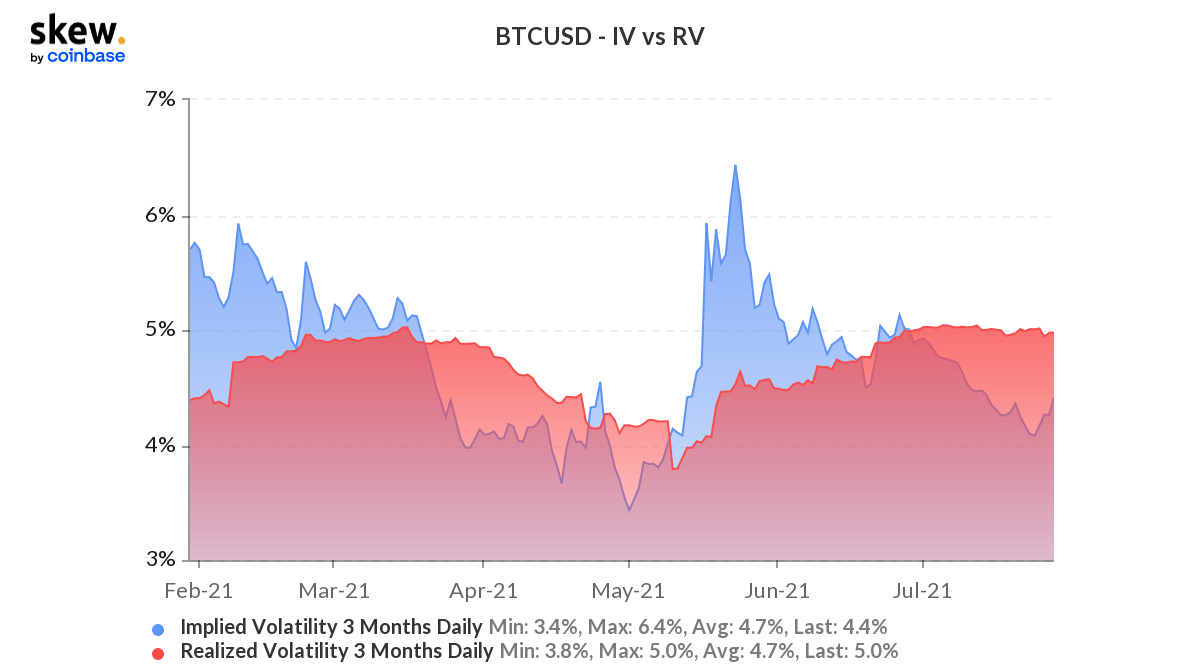
Another interesting trend that was spotted was in the Realized volatility (RV) vs. Implied volatility (IV) charts of Bitcoin for six months. A parabolic rise in the IV amid the rising price meant that traders expect the prices to rise further. Such a parabolic move was last seen in May when Bitcoin rallied. Can that be the case this time too?
That depends on whether Bitcoin breaches the $42k mark by the end of this month.

Source: Skew
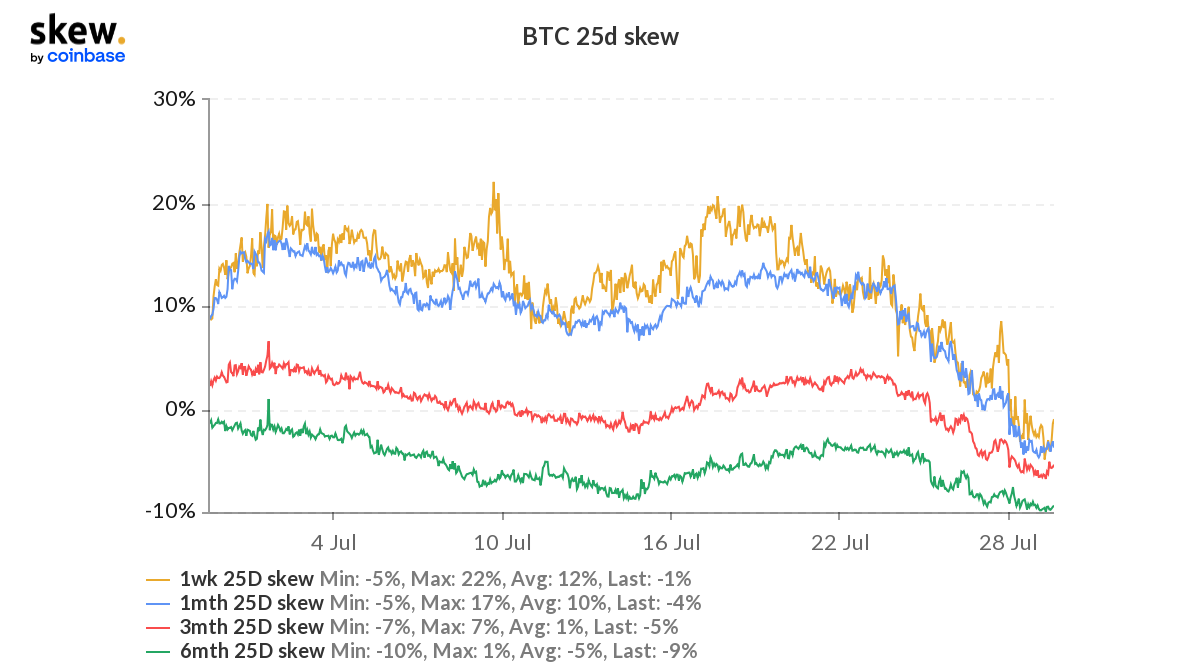
Apart from that, Bitcoin’s one-month put-call skew, which measures the cost of puts to calls or bearish bets to bullish bets, declined sharply from 15% to -2%, at press time. What’s more, the total one-week put-call skew declined from 13% to 5%.
This narrowing of the spread between prices for puts and calls and the narrowing between the IV and RV essentially implies that most investors, traders are not keen on another price drop.
However, Bitcoin will lose this bullish narrative without a clean break above $42k. Any thought of BTC going past $100k should only be entertained then.


