
- Bitcoin price action showed low orderbook depth.
- Market indicators say the way is up.
Recently, Bitcoin [BTC] has experienced a significant drop, much like other cryptocurrencies, following the market crash on 5th August.
Despite a brief recovery that pushed Bitcoin to $60K, it faced strong resistance and quickly fell to $54K.
On the 1-hour timeframe, BTC price action showed low orderbook depth at 0-1% and 1-5%. Historically, low orderbooks have often signaled the bottom of a rally, followed by a bullish trend.
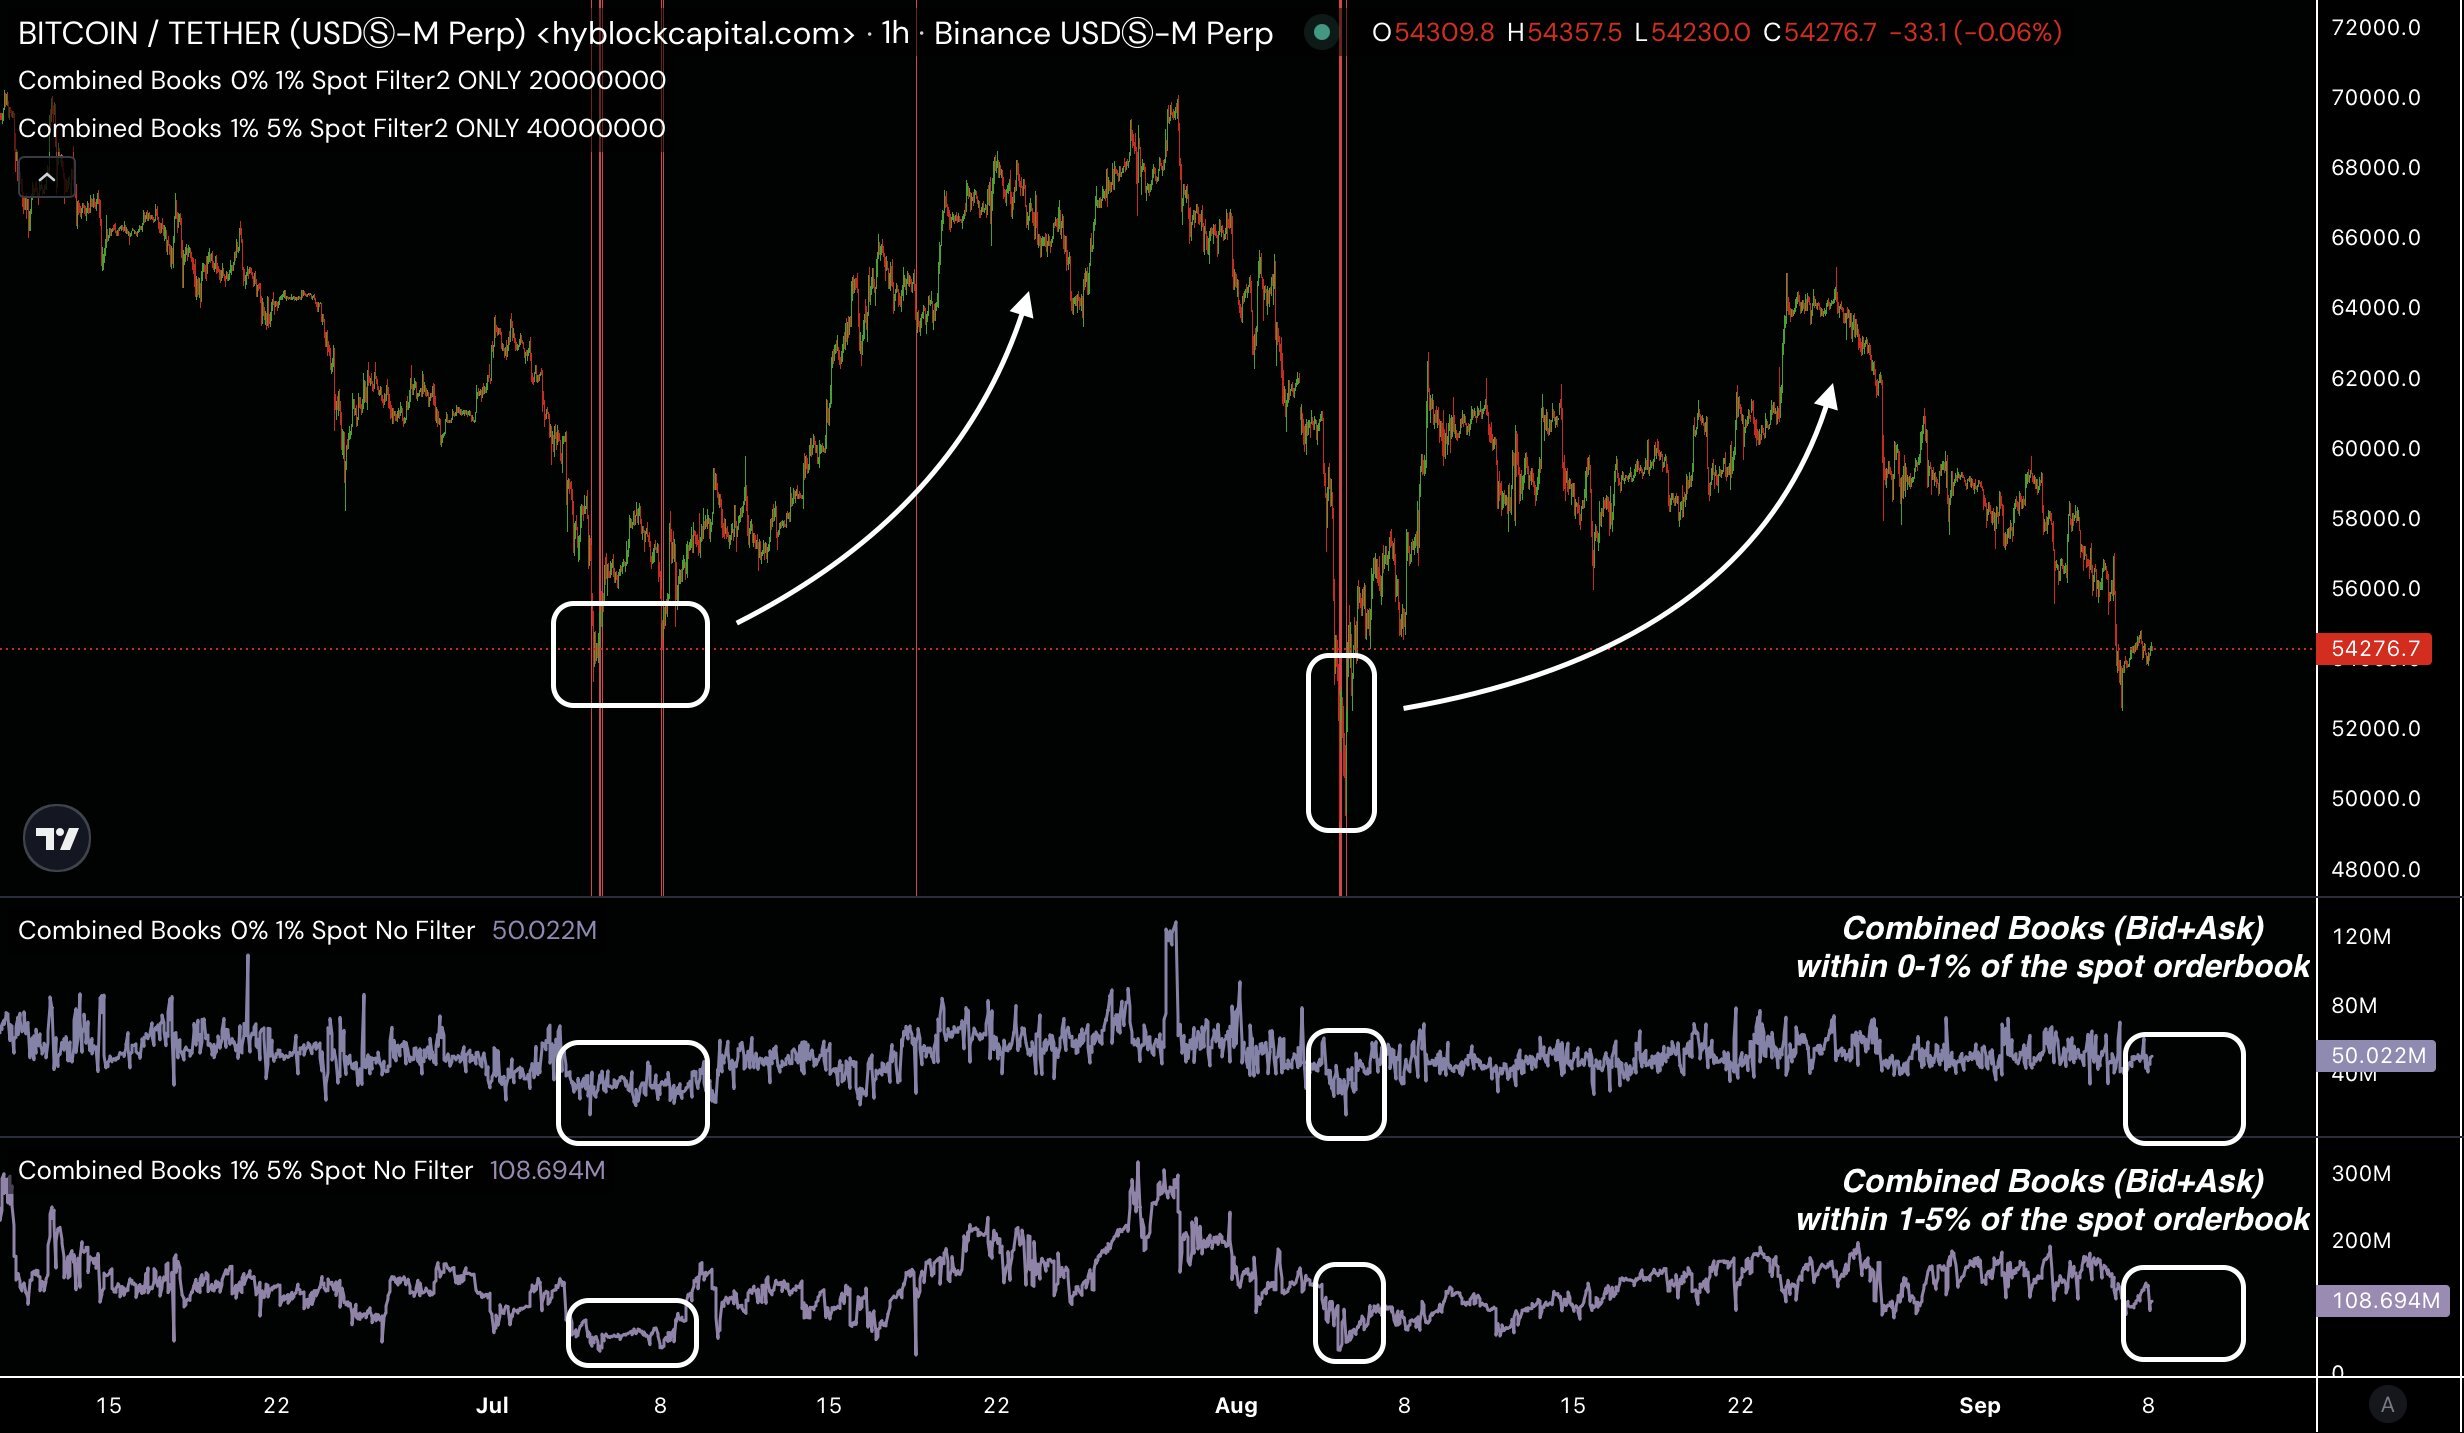
Source: Hyblock Capital
This suggests that watching the orderbooks closely for a potential reversal in Q4 2024 will be crucial for predicting future price movements.
BTC Fibonacci levels
Looking at Bitcoin’s price action, BTC failed to respect the 0.618 Fibonacci level but did bounce from the 0.786 level, which has been the most reliable Fibonacci retracement this year.
This level now represents the last chance for a higher low, which could signal a potential bounce if combined with low orderbook depth.
If Bitcoin follows past patterns, filling the large wick caused by the Japanese stock market crash could lead to a bounce, pushing the price higher.
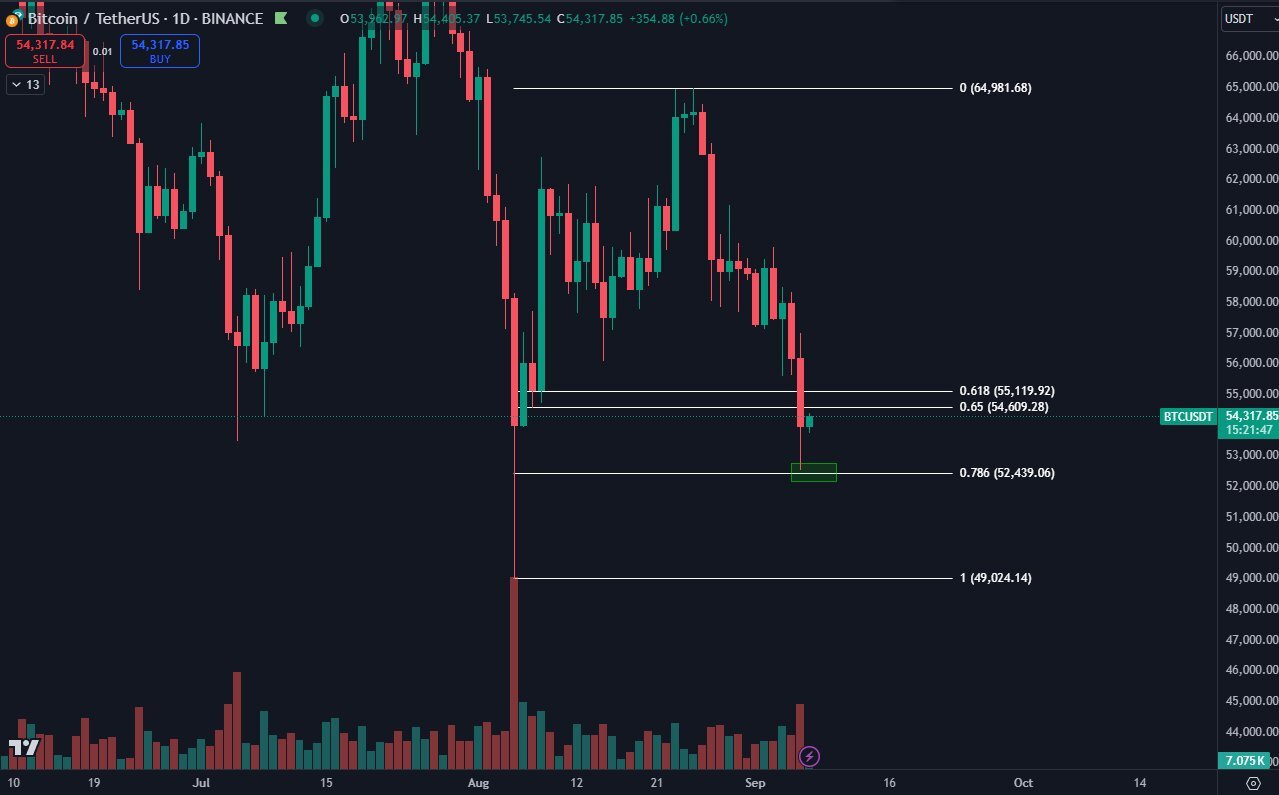
Source: TradingView
However, if the pattern fails, BTC may decline further before seeing a rebound.
Bitcoin’s Mayers band
The Mayer’s Band offers additional insights into this Bitcoin bull cycle. It suggests that the cycle is not over yet, with a potential target of $95K, which would not signal the cycle’s end.
A longer-term target of $140K is possible. For long-term traders, staying away from short-term charts may be wise until Bitcoin reaches a new all-time high.
The duration and magnitude of this Bitcoin cycle appear to be greater than previous cycles, which could indicate more growth ahead.
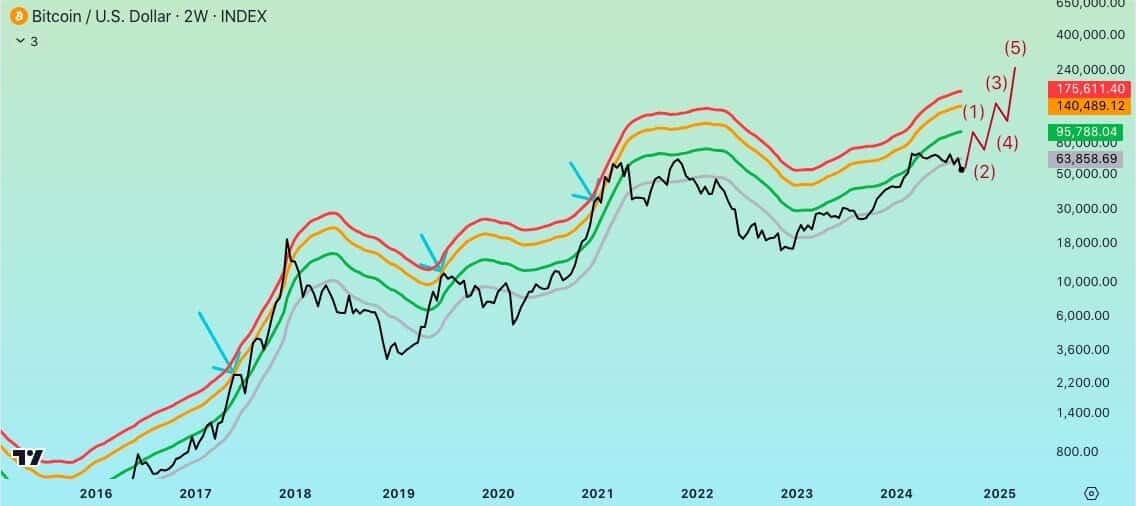
Source: TradingView
Bitcoin adjusted dormancy flow
Another key indicator is the Bitcoin adjusted dormancy flow, which currently reads around $10. Historically, BTC price has always bounced from these levels.
When combined with the low orderbook depth, this adds further confidence to the idea that Bitcoin could see a price rebound soon.
There is also the possibility that BTC might briefly drop to $50K before making a significant upward move, potentially displacing its all-time high.
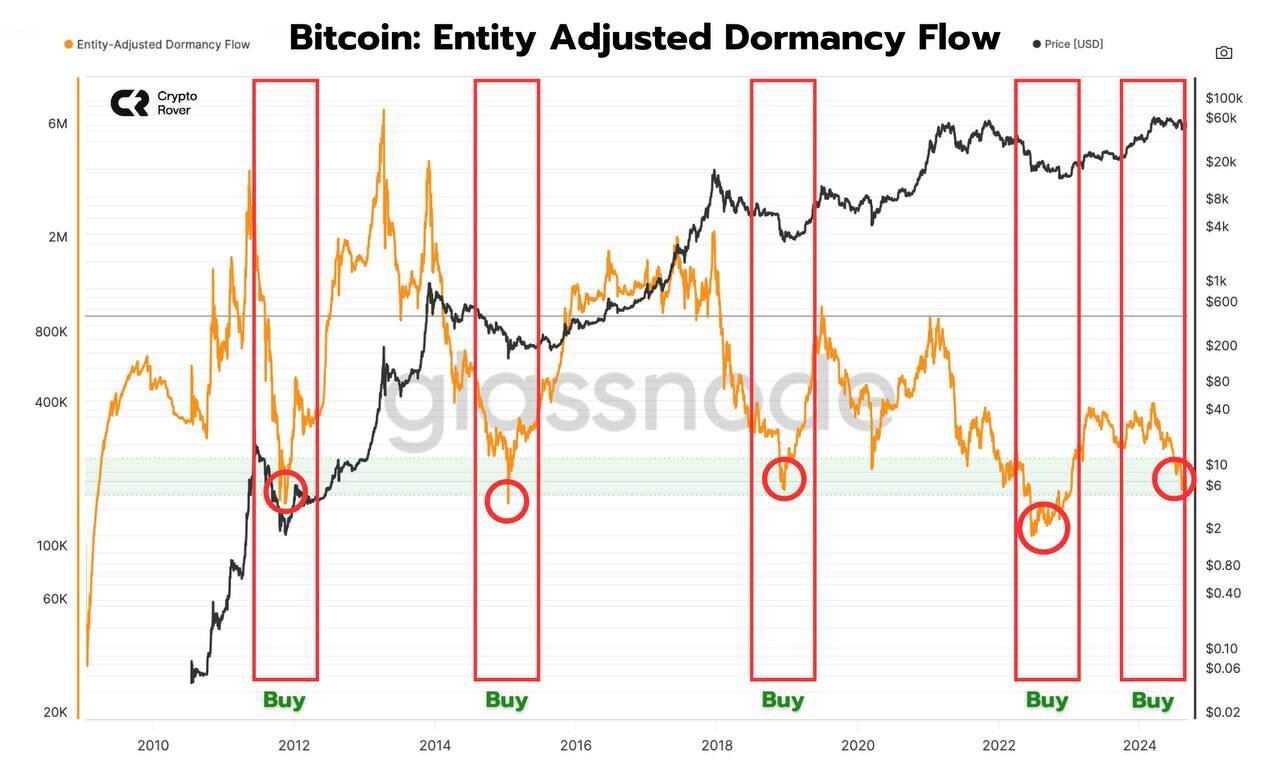
Source: Glassnode
Bitcoin whale activity increasing
Lastly, whale activity is on the rise, with BTC whales increasing their long positions with low leverage, typically between 1.2x and 3x.
Read Bitcoin’s [BTC] Price Prediction 2024-25
Unlike retail traders, whales use algorithms to Dollar Cost Average (DCA) into low-leverage longs as the price drops, avoiding emotional decision-making.
This calculated approach from Bitcoin whales could help propel BTC price to new, higher levels as they accumulate during the downturn, setting the stage for a possible major price surge.
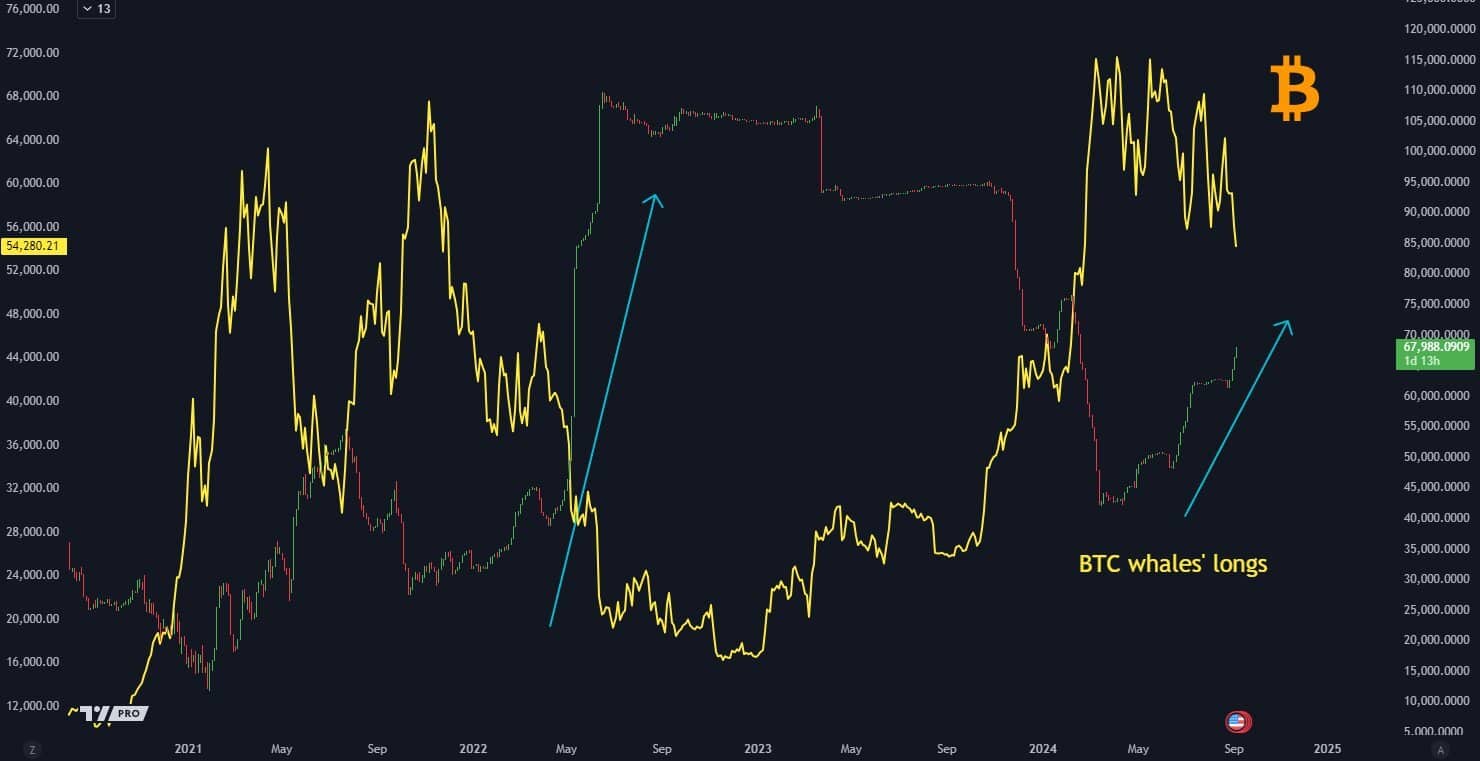
Source: TradingView