Bitcoin whales ease selling: Assessing odds of a $72K consolidation
The sellers remained firmly dominant, but the most intense phases of selling might be over.

- The falling whale activity and Coin Days Destroyed (CDD) were both encouraging signs.
- There is a chance for a deeper correction, but the worst of the selling might be over.
Bitcoin [BTC] prices fell to $76.6k on the 11th of March before seeing a bounce. At press time, the price was $82.8k, an 8.2% bounce in just over 24 hours. The downtrend was going strong, and whether this was the final dip was unclear.
Trying to catch falling knives is a pointless exercise, and it’s better to pick them up after they hit the floor. Yet, it might help investors to understand how far the price is from the floor, and metrics can shed some light on this.
Short-term BTC holder losses similar to consolidation conditions

The behavior of whales is a good insight into how BTC could move next since these are the wallets with the power to move the markets. In a post on CryptoQuant Insights, analyst Darkfost noted that Binance, the largest crypto exchange by volume, saw a falling exchange whale ratio.
The Exchange Whale Ratio tracks the proportion of the top 10 inflows relative to total inflows on an exchange. A higher value indicates increased whale activity, typically signaling greater selling pressure.
Since November 2024, the metric had been rising. However, it has declined over the past month, offering a glimmer of hope. Despite this, BTC remains 11% below the $92K range lows observed in January.
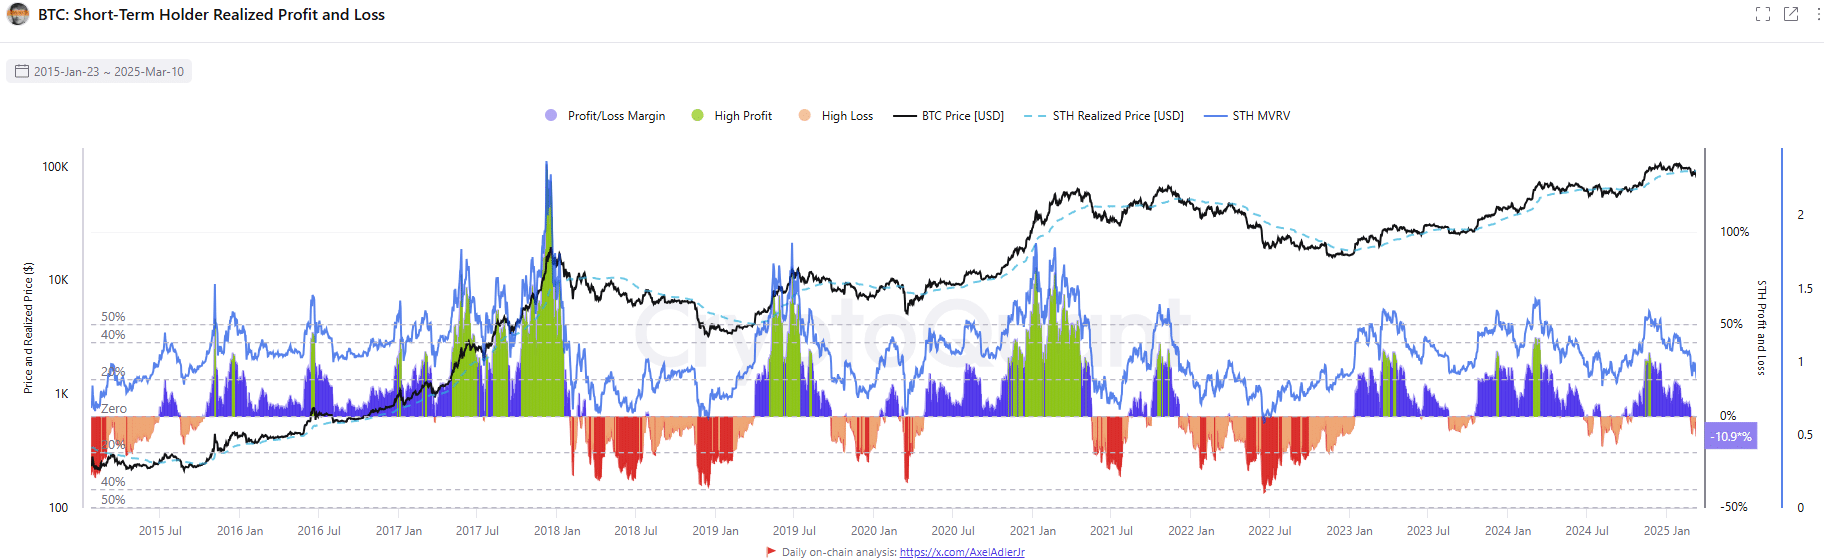
The STH Realized Profit/Loss Ratio stood at -10.9%, at press time. This aligns with trends observed during June-August 2024 and August-October 2023, periods when Bitcoin hit new two-month lows before entering a consolidation phase lasting 2 to 3 months.
A similar pattern could unfold this time. While further losses cannot be ruled out, the worst may already be over. Consolidation around the $72K support level over the next three months appears to be a realistic possibility.
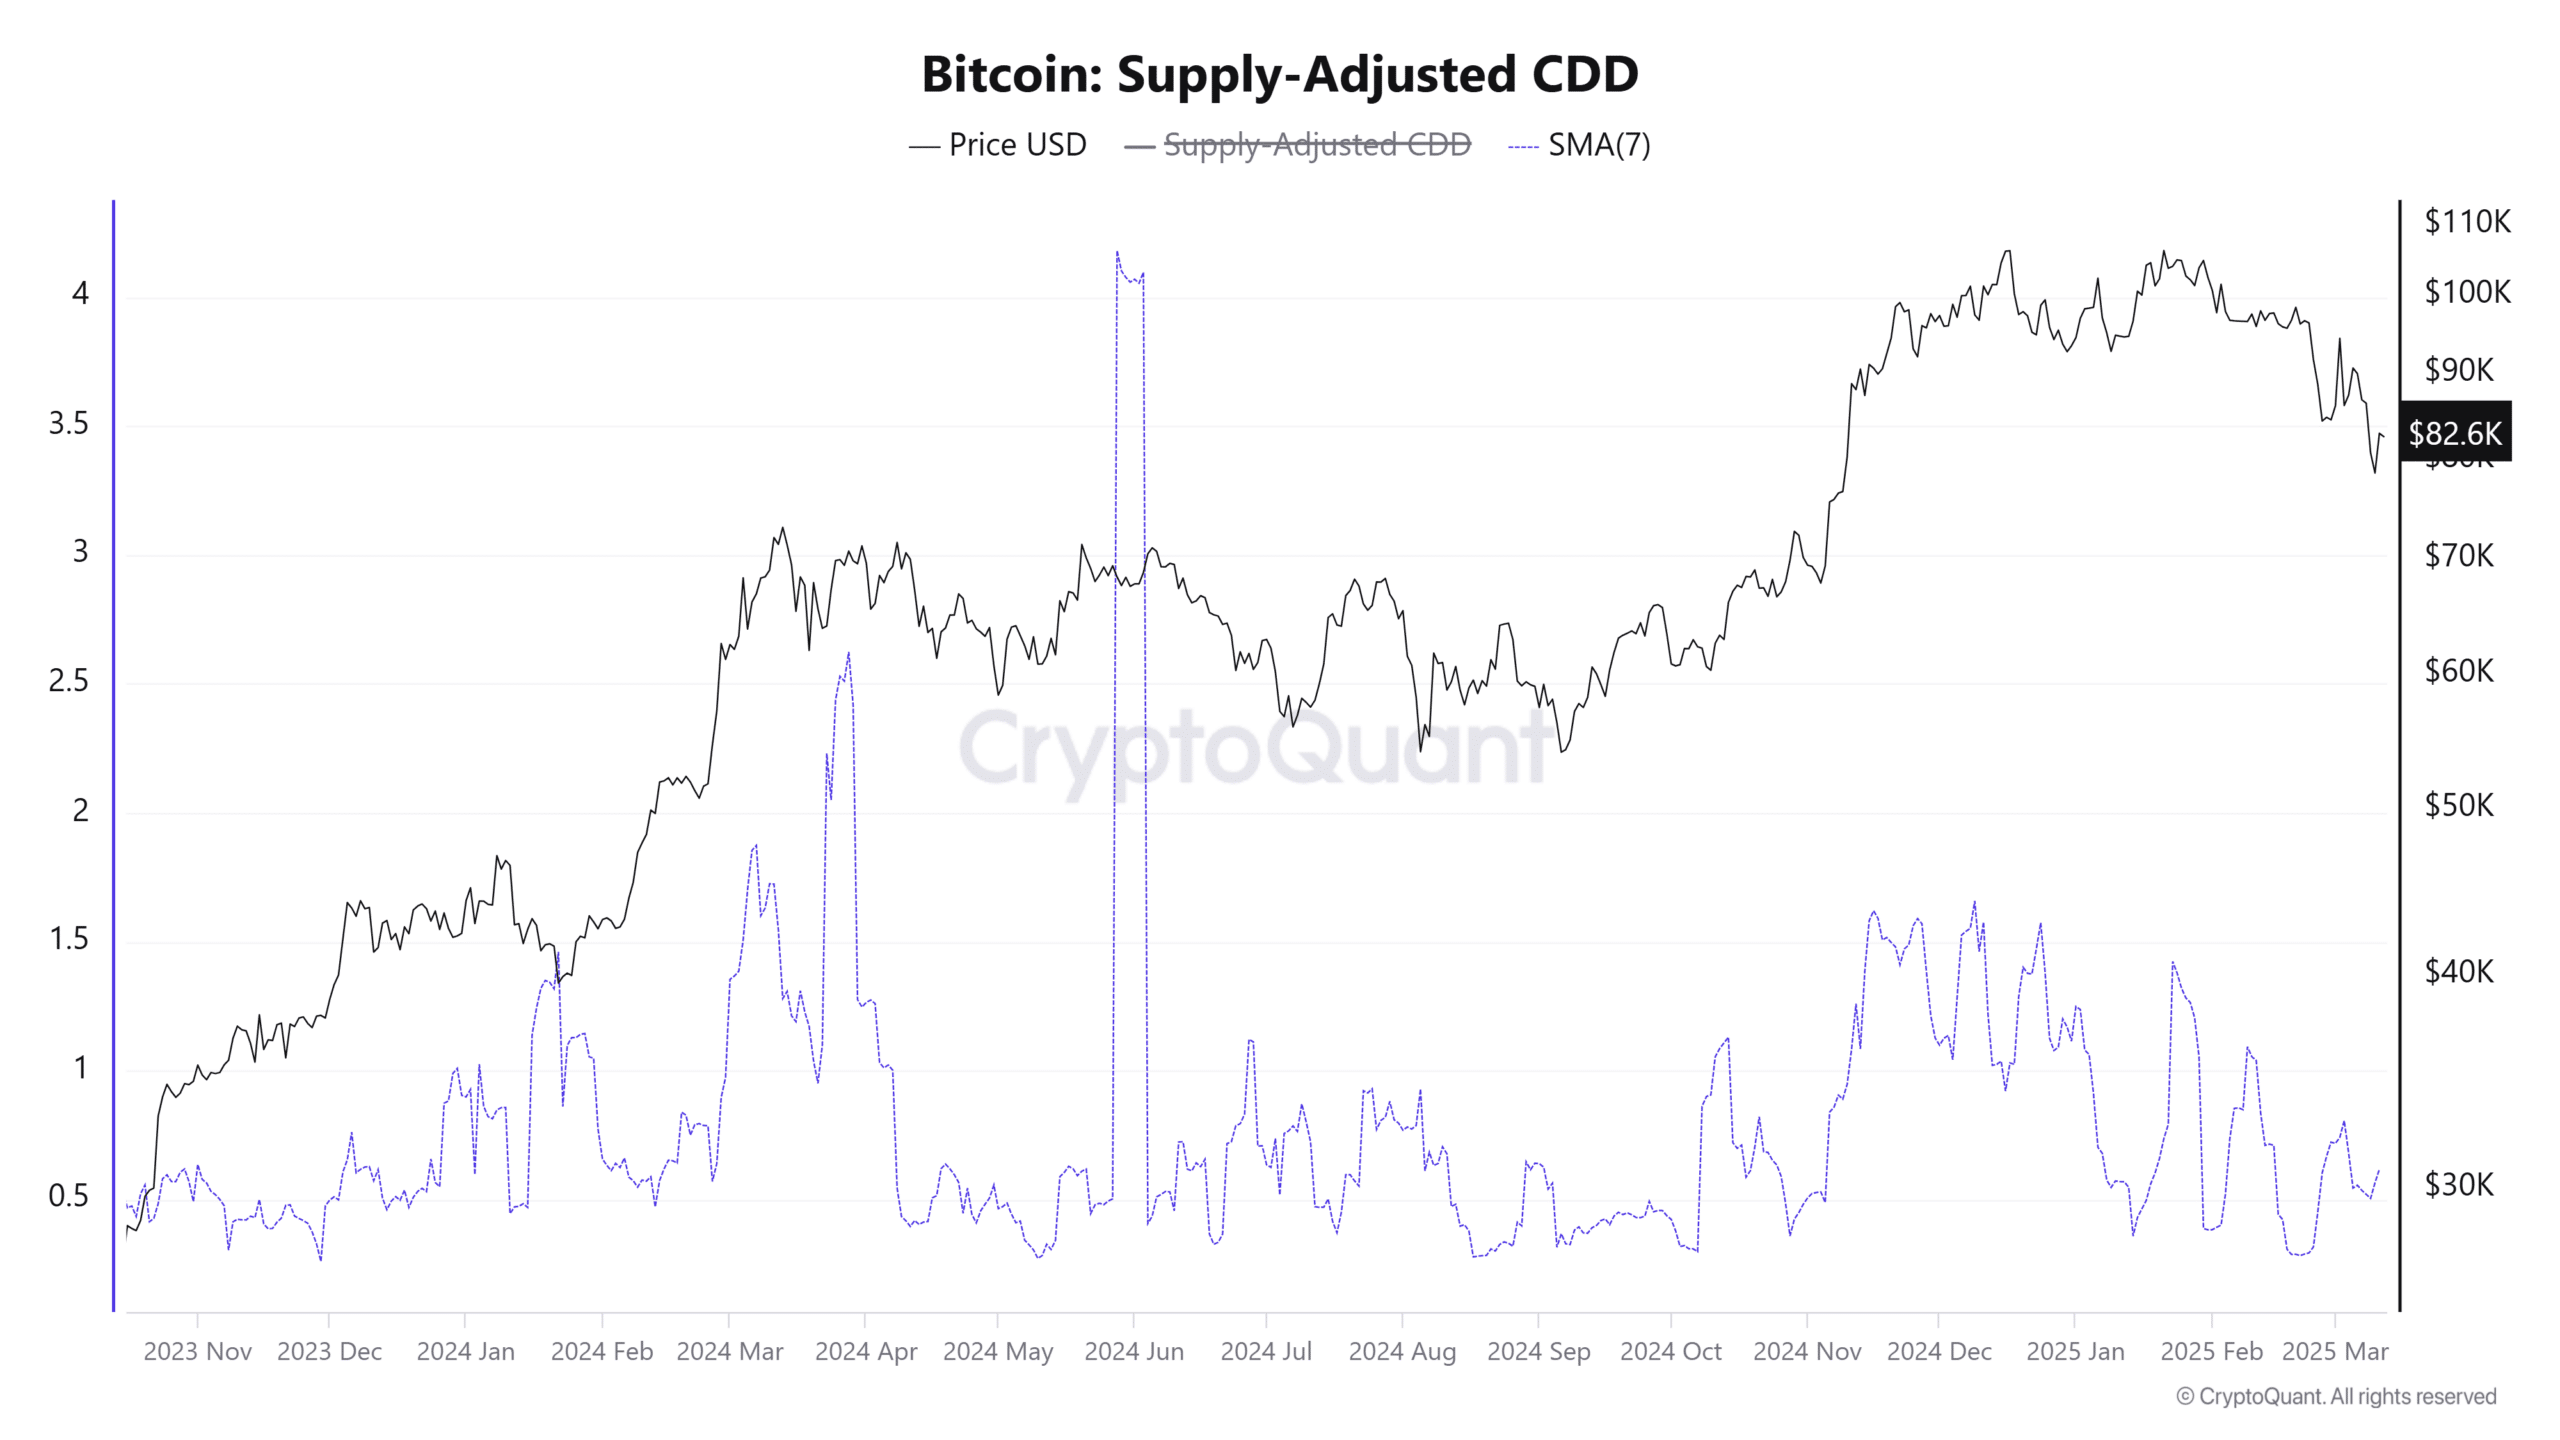
The supply-adjusted Coin Days Destroyed (CDD) metric is calculated by multiplying the number of coins by the days since they were last moved. Spikes in this metric signify that older coins are being sold. To adjust for supply, the original CDD is divided by Bitcoin’s circulating supply.
Since December, the 7-day Moving Average (7DMA) of this metric has consistently made lower highs, indicating a decline in selling activity and reduced movement among older tokens.
This is an encouraging sign, suggesting that accumulation may soon follow. Although sellers remain dominant overall, the most intense phases of selling appear to have passed.