Expecting Bitcoin to hike after the halving? Think again because…
The BTC retracement is expected to last for about five weeks like the last run.

- Bitcoin appeared to be repeating the 2020 run, an analyst noted.
- The true price discovery run of BTC might have to wait till September 2024.
Bitcoin [BTC] posted an all-time high of $73,835 on the 14th of March according to data from Coinbase. It has broken its previous ATH before the halving, which is expected to occur on the 23rd of April. However, estimates vary from 15th April to 23rd April.
This did not occur in the previous cycle when BTC was trading at $9k, just under half of the 2017 high of $19.9k. This led to one analyst theorizing that BTC could be experiencing an accelerated cycle, but the similarities remained.
The idea of the pre-halving retrace
In a post on X (formerly Twitter), Rekt Capital explored the idea of how history continues to repeat. In 2020, BTC began to rally before the halving event and settled into a 35-day retracement. The analyst put forth the idea that the same thing is occurring once again.
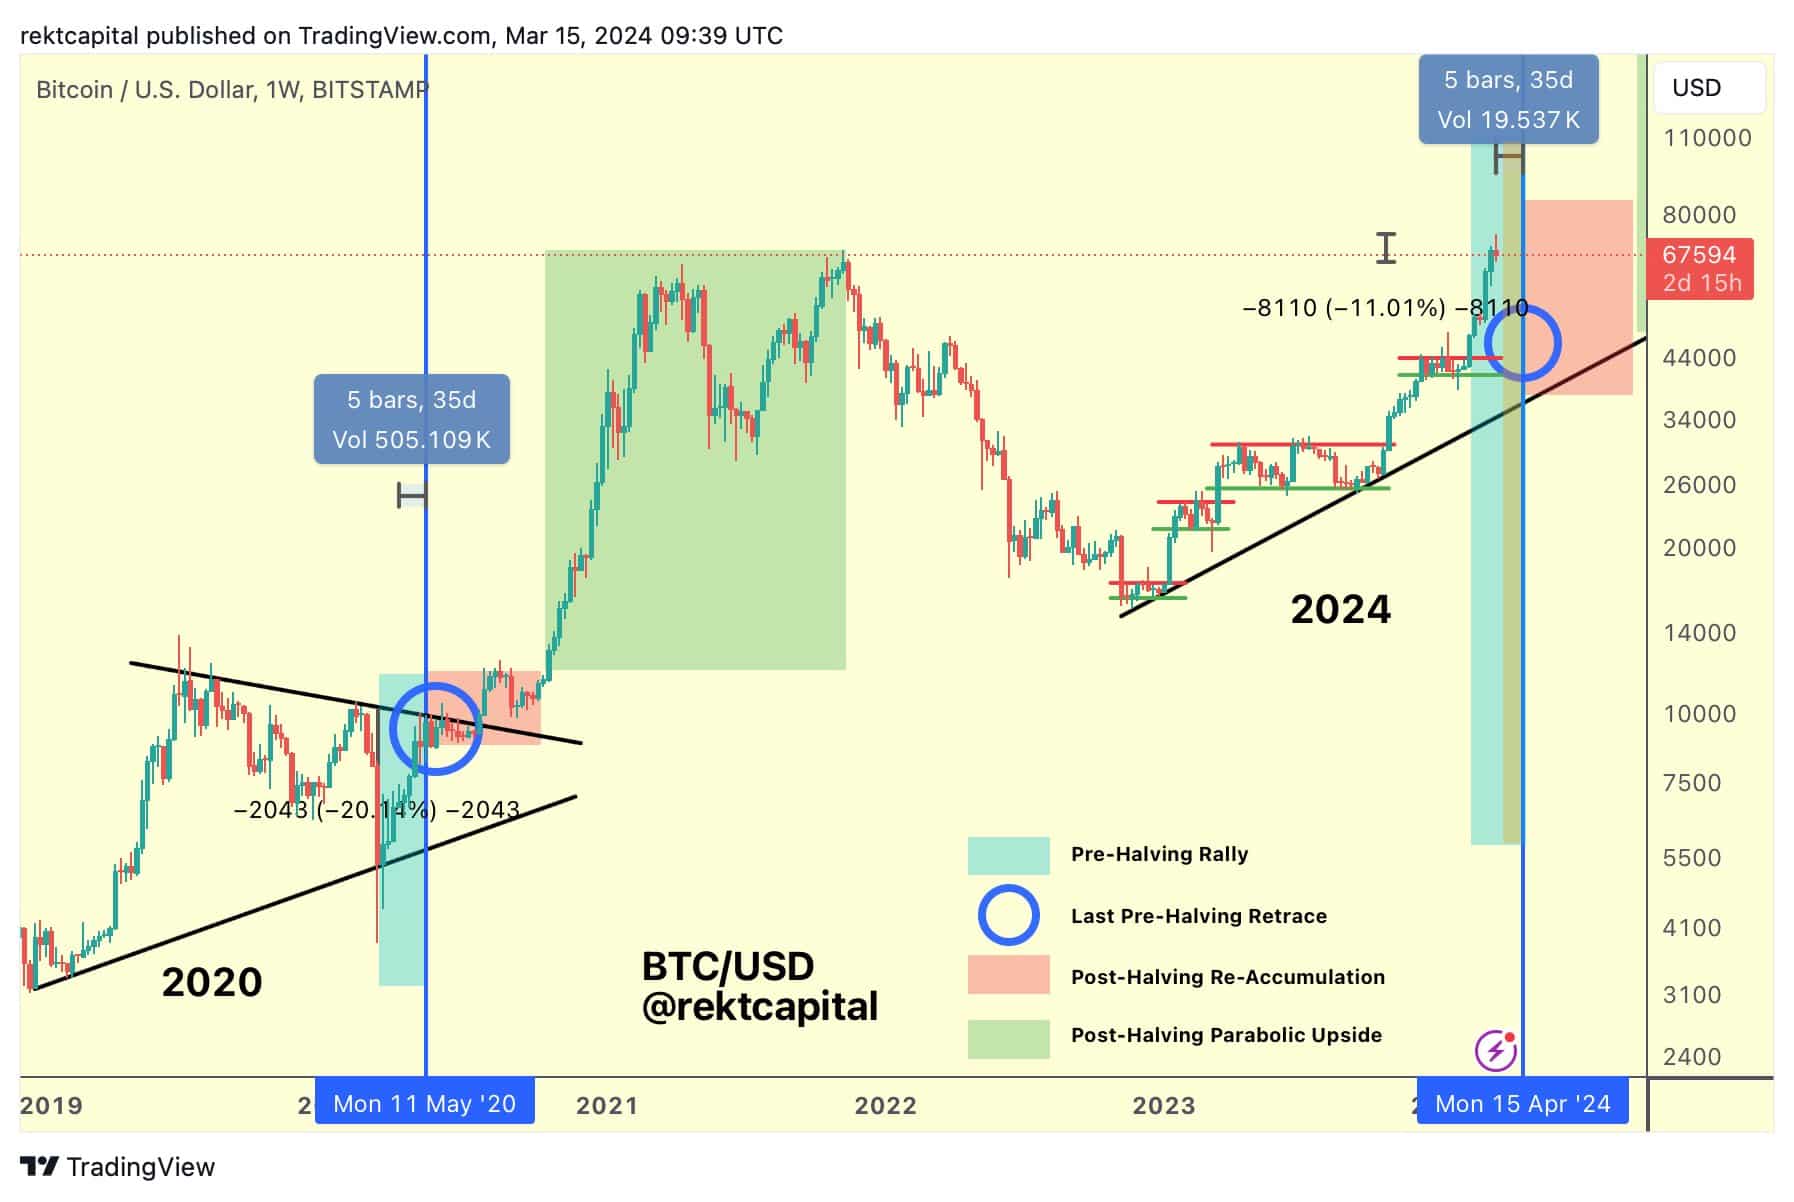
The pre-halving rally ran for eight weeks in 2020, with the retracement expected to last another five weeks. This might not see Bitcoin prices go down by a lot, but rather, find a support level and stay there for the post-halving accumulation.
The chart highlighted that the parabolic bull run did not commence until 23 weeks after the date of halving. The 2020 run saw BTC quickly go into price discovery and continue to soar skyward till it reached $69k 55 weeks later, or just over a year.
If 15th April does turn out to be the date of the halving event, then the true bull run of Bitcoin could commence 23 weeks later on the 23rd of September, 2024. Again, this is based on the analyst’s perspective that history is repeating itself.
How deep could the BTC retracement go?
Is your portfolio green? Check the BTC Profit Calculator
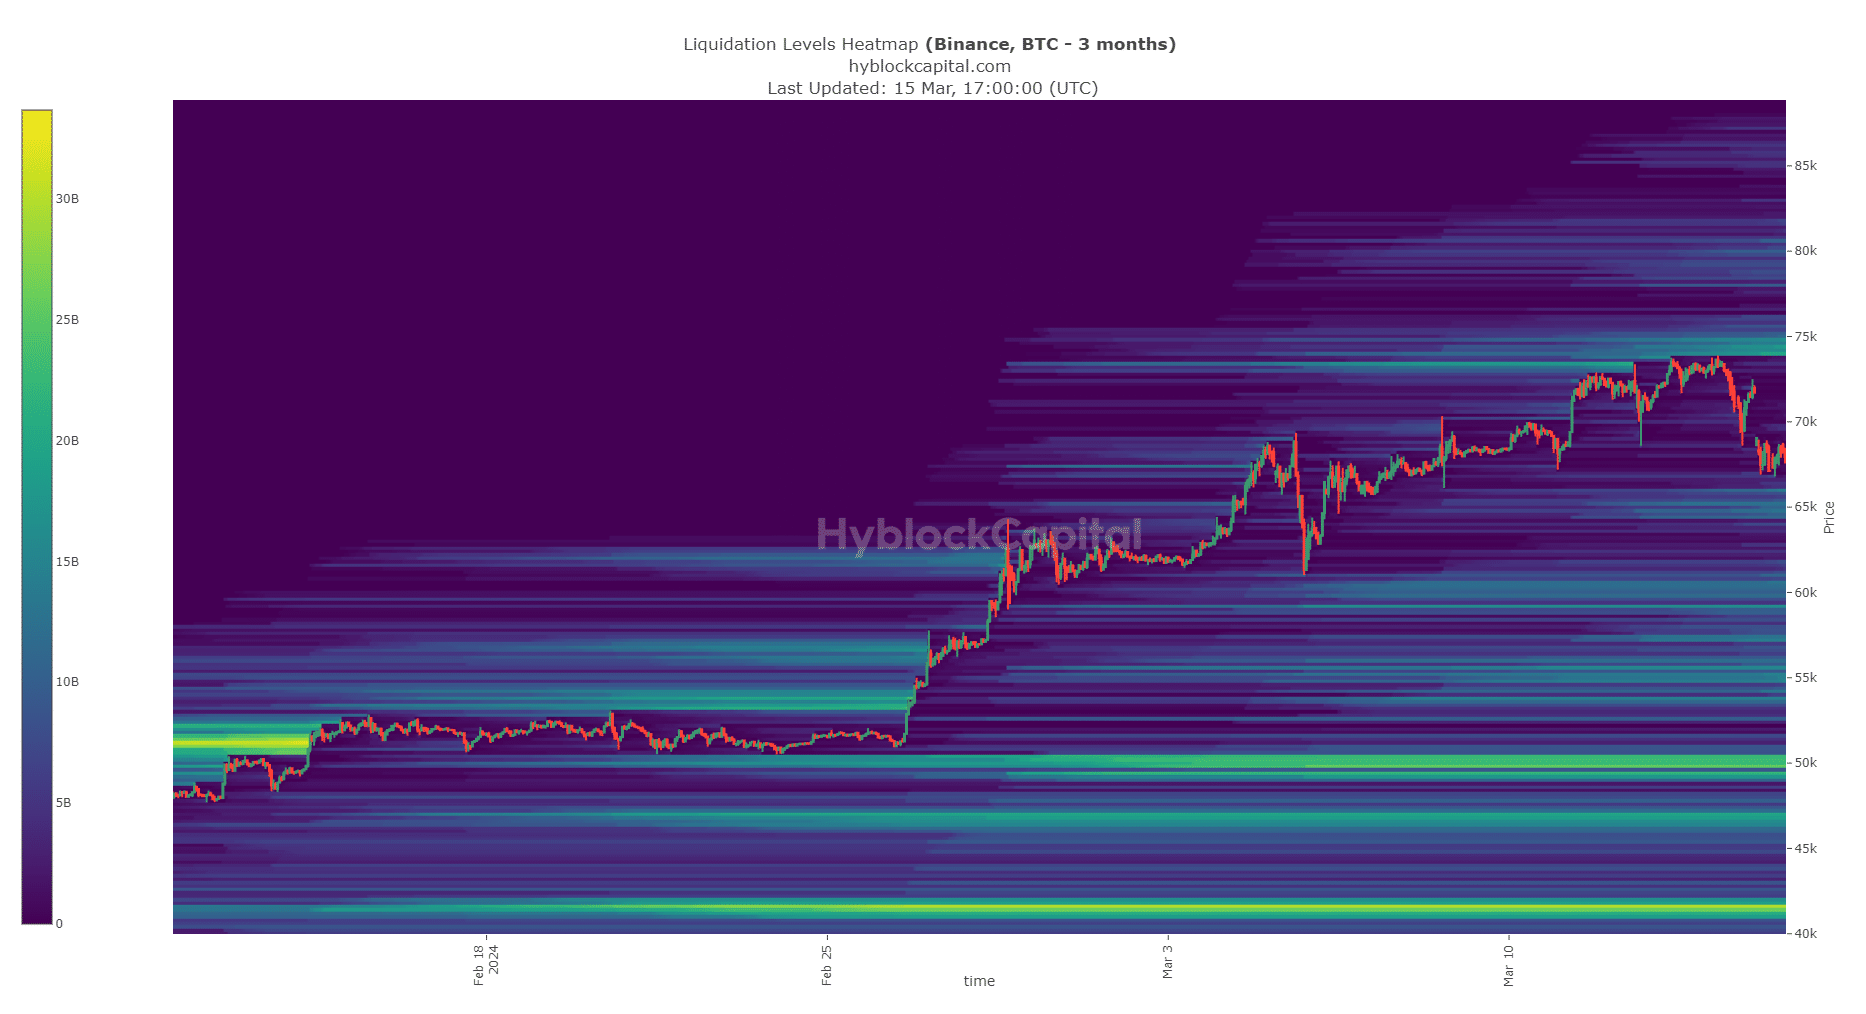
Since prices are attracted to liquidity, AMBCrypto decided to rely less on history and more on the liquidation levels heatmap to understand where Bitcoin could move next. The $73.8k-$75k region was estimated to have multiple levels with liquidations worth $15 billion.
The $74k level had $19 billion in estimated liquidations. In terms of support, the $64.6k-$65.8k had multiple liquidation levels worth $8 billion as estimated by Hyblock data. Therefore, it was likely that the current Bitcoin dip would halt at this support zone.


