Bitcoin will hit $50k by the end of this week; do metrics affirm that narrative?

Bitcoin price has been consolidating above $44,500 for quite some time. Even the 1 April downtick failed to move below this support level, further strengthening the bullish outlook.
Regardless, BTC has failed to show volatility and has not moved higher for the last week or so. But two on-chain metrics suggest that the big crypto is due for a volatile move to the upside and is likely to hit a crucial psychological level by the end of this week.
The likelihood of Bitcoin price hitting $50,000
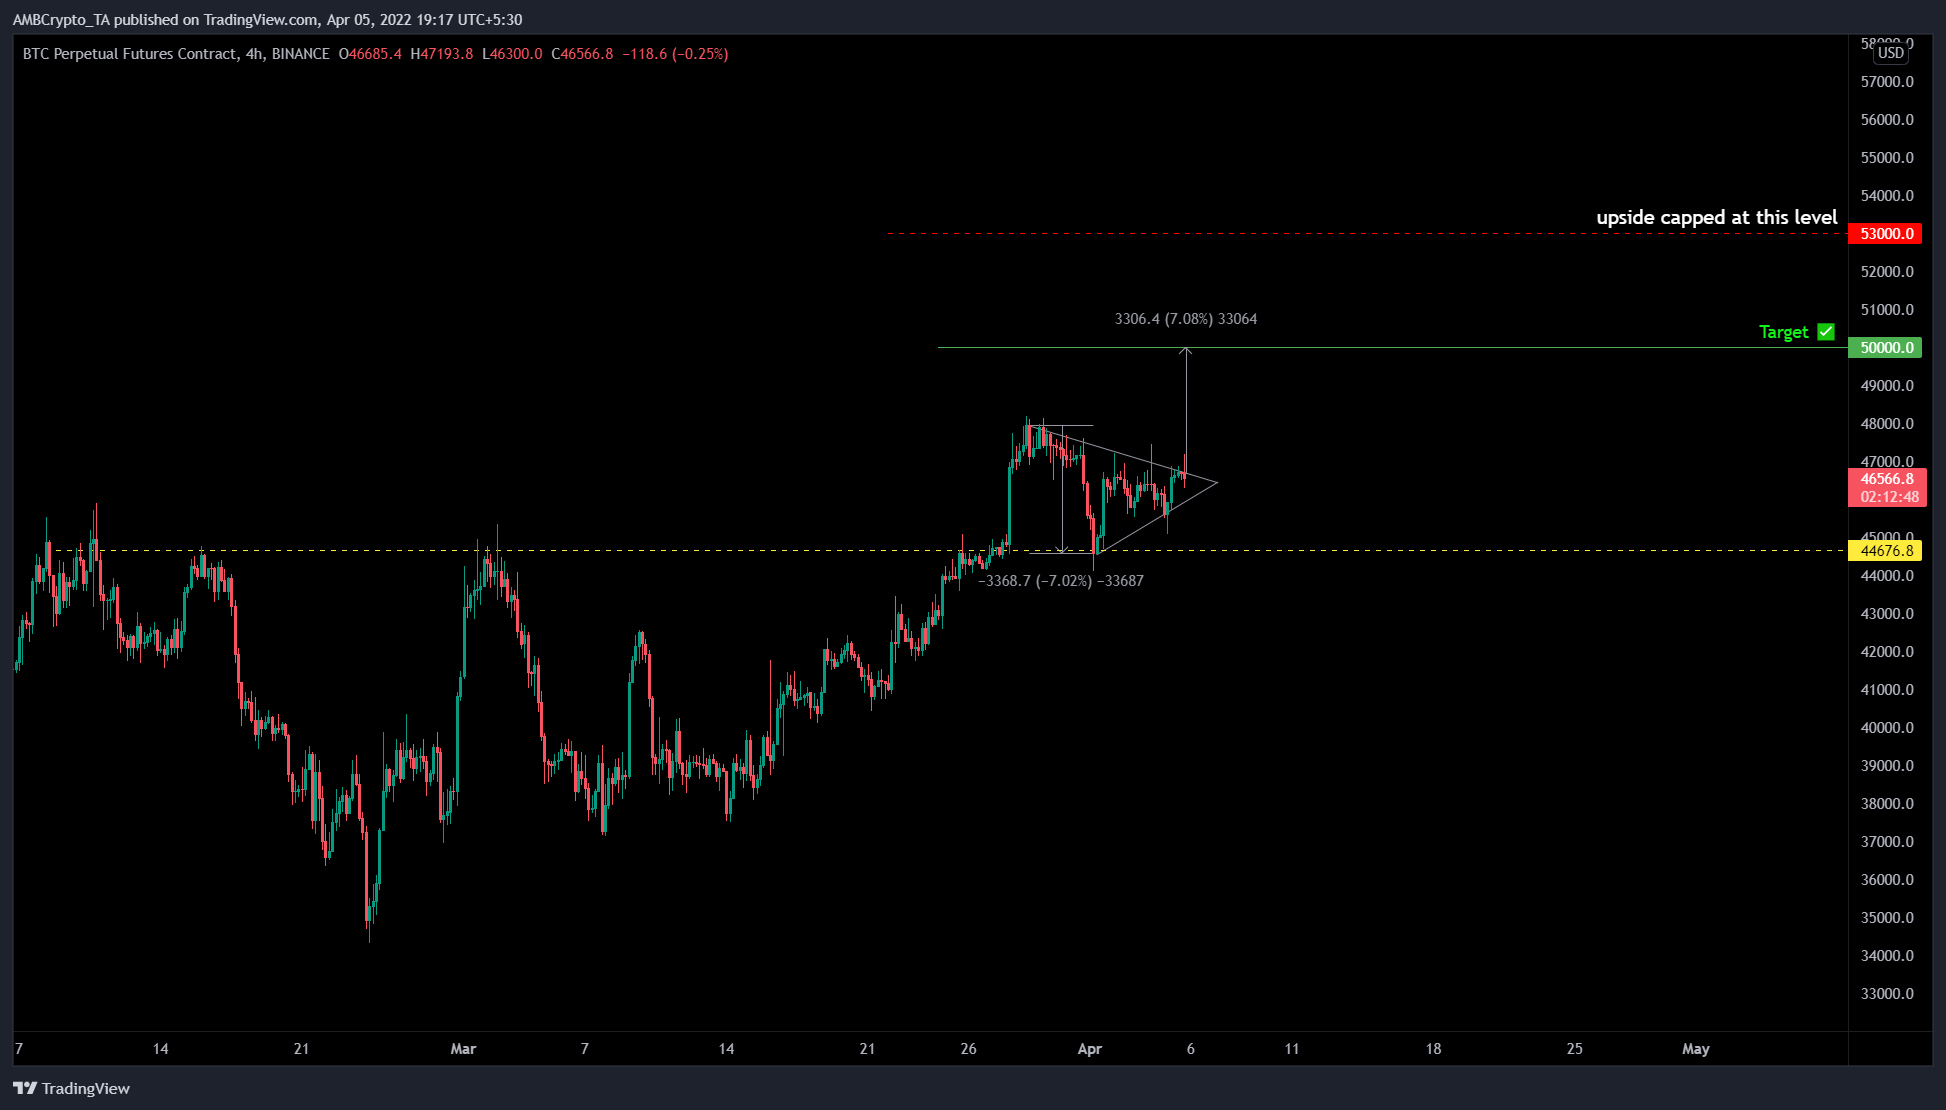
Bitcoin price has been stuck hovering below a declining trend line since the 28 March candlestick’s closing price. Any attempt to move beyond this barrier has failed. However, drawing trend lines connecting the candlestick bodies of the swing highs and swing lows since 28 March results in the formation of a symmetrical triangle.
This technical formation forecasts a 7% upswing to $50,000 determined by measuring the distance between the first swing high and low and adding it to the breakout point. Assuming Bitcoin price breaches this pattern to the upside at roughly $46,685, it will signal a bullish breakout and trigger an ascent to $50,000.
Interested investors should watch the breakout carefully and plan their entries accordingly. In a highly bullish case, where BTC moves above the $50,000 psychological level, there is a good chance for this rally to extend to $53,000. The uptrend for BTC remains capped at this barrier.
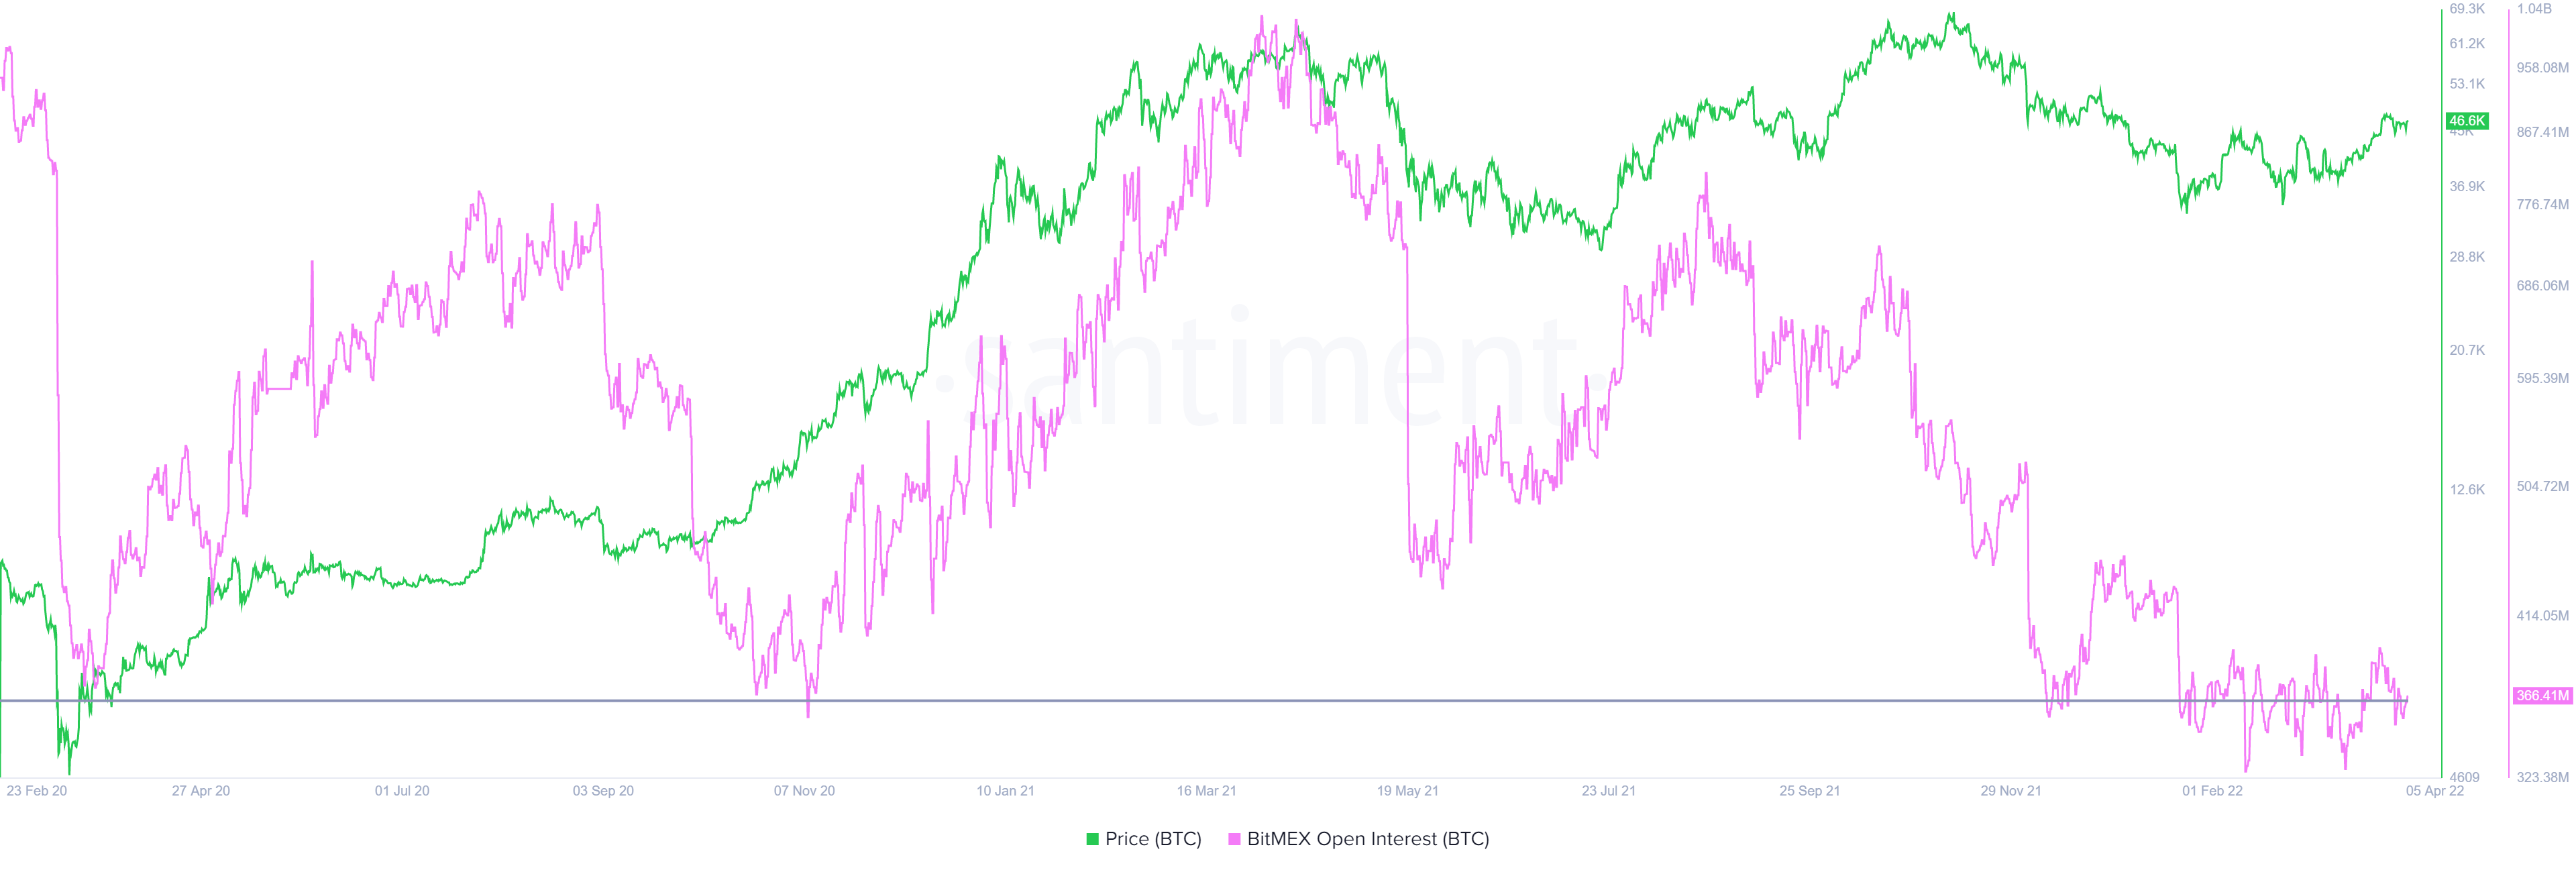
Supporting the bullishness for Bitcoin price from a technical perspective is the recent dip in the open interest seen on BitMEX. The last three times the open interest tagged $365,000, the Bitcoin price has rallied massively.
Therefore, the recent retest is a buy signal, especially if history repeats. This on-chain index suggests that BTC will rally quickly and the immediate hurdle that it will tag is the $50,000 barrier.
Additionally, the 365-day Market Value to Realized Value (MVRV) mode is hovering above the zero line, indicating that investors are not at a loss and therefore, a sell-off seems unlikely. This indicator is used to assess the average profit/loss of investors who purchased BTC over the past year.
A value below -10% indicates that short-term holders are selling at a loss and is typically where long-term holders tend to accumulate. Therefore, a value below -10% is often referred to as an “opportunity zone,” since the risk of a sell-off is less.
The recent uptick in Bitcoin price has pushed the 365-day MVRV above the zero line, but careful observation reveals that the local top for this index has been around 20% for the past two and a half years.
This setup on the 365-day MVRV suggests that there is more room for the Bitcoin price to move higher.


