Bitcoin [BTC] witnessed a bull trap on Wednesday as further losses are anticipated
Despite the brief move back above a local resistance, Bitcoin bulls were unable to hold on to their gains as the sellers forced prices back toward the $27k mark.

Disclaimer: The information presented does not constitute financial, investment, trading, or other types of advice and is solely the writer’s opinion
- The market structure was technically bullish.
- The failure to defend the former resistance upon the bounce showed it could have been a liquidity hunt.
U.S. CPI data for April showed that inflation rates continued to fall. The markets anticipated the annual inflation rates to remain at 5% but the data released on Wednesday showed the CPI rose by 4.9%, which was the smallest 12-month increase since April 2021.
Read Bitcoin’s [BTC] Price Prediction 2023-24
The reaction in the crypto sphere was positive for a few brief hours. Bitcoin [BTC] jumped back above the $27.8k resistance and pushed as high as $28.3k. This minor bounce did not transform into a rally, and at the time of writing BTC was back beneath the same resistance level.
Market structure break of bull trap?
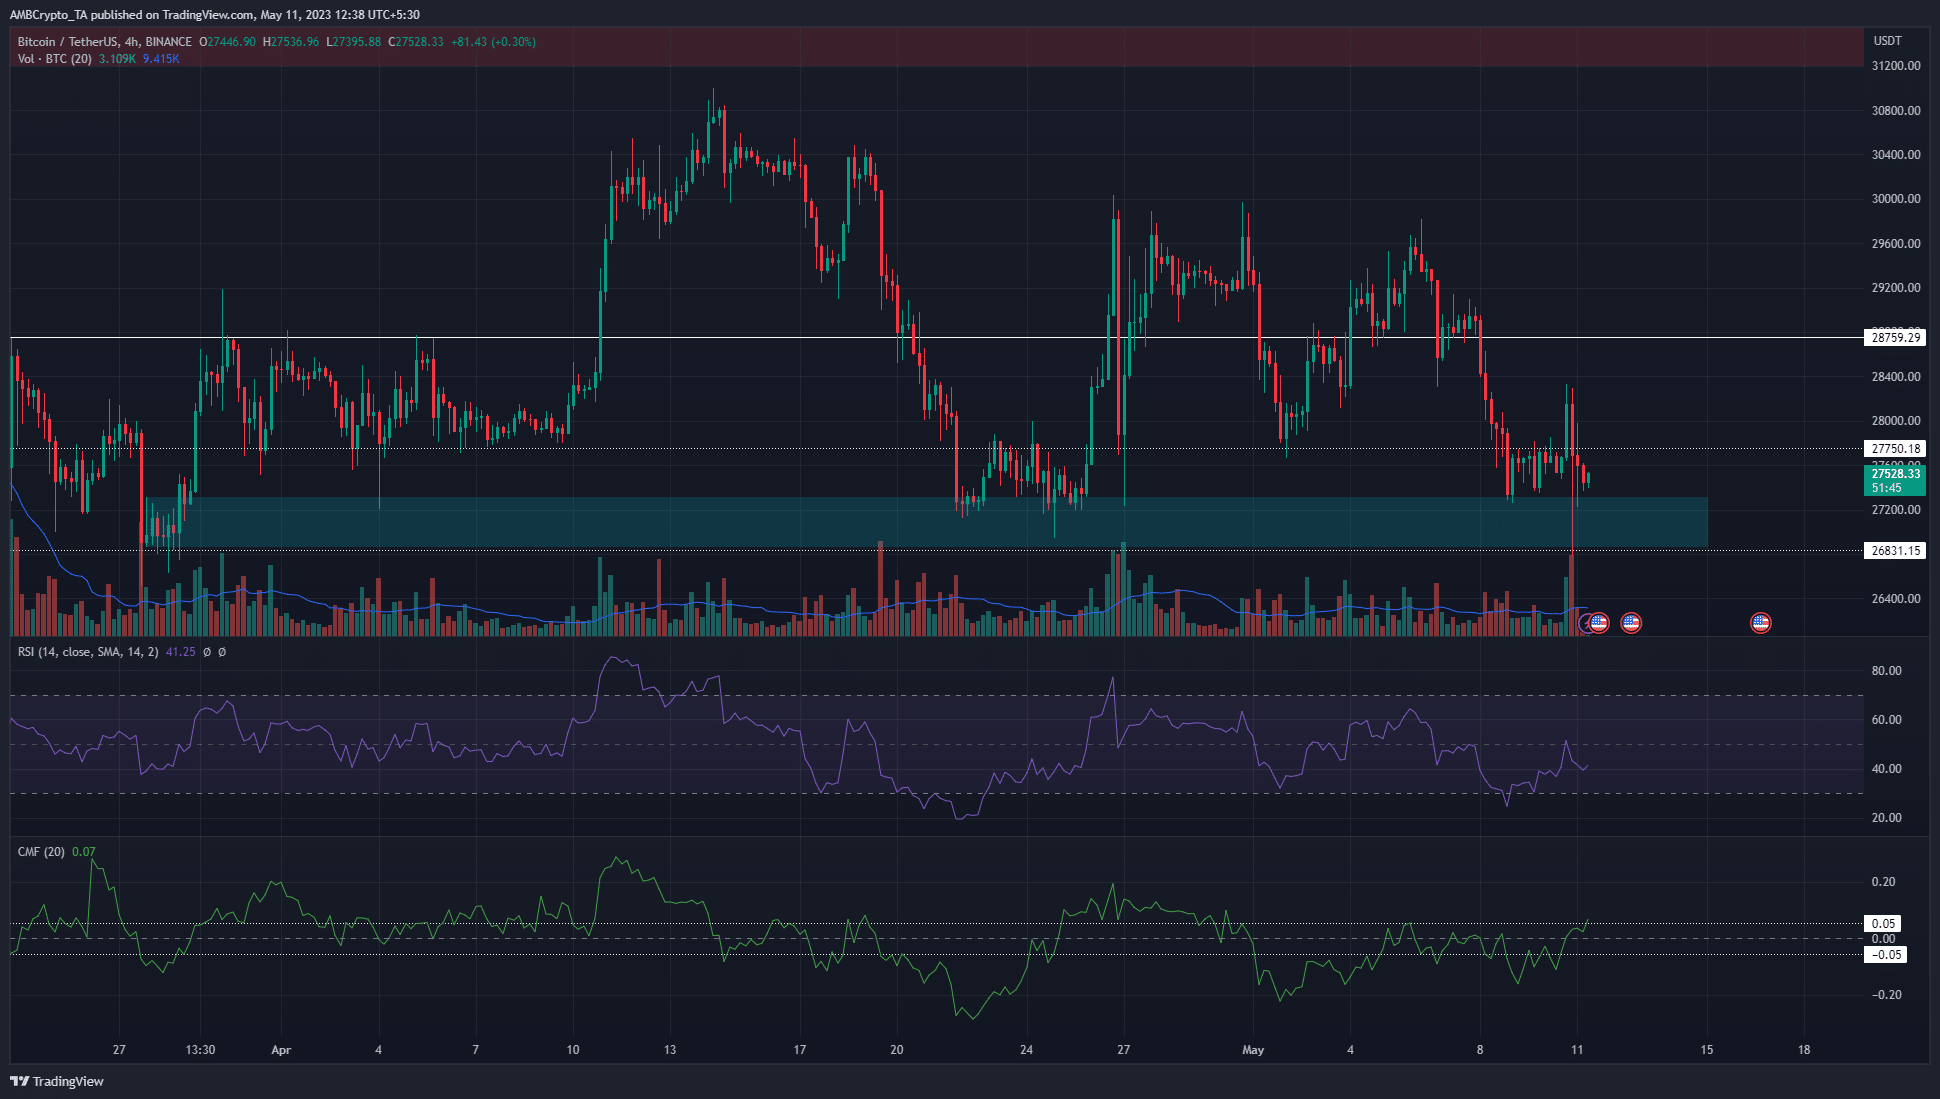
The 4-hour chart above showed a strong zone of support at the $26.8k-$27.2k area. This was also an H4 bullish order block from late March. The bounce above $27.8k on Wednesday broke the market structure and flipped it bullish.
Yet, the inability of the buyers to defend the $27.8k level as support was a cause for concern amongst the bulls. If buying pressure was strong, why were the sellers able to wipe out the gains so quickly?
The CMF showed a value of +0.07 to indicate capital flow into the market. Meanwhile the RSI was below neutral 50 and showed the downtrend was still in progress.
Therefore, we have the RSI and CMF in disagreement, alongside a bullish market structure. A trading session close below $27,262 on the 4-hour chart will see the structure flipping bearish once more.
As things stand, it could be prudent to wait for price action to develop. A BTC move above $28.2k or below $27.2k would likely highlight the direction of the crypto markets over the next week.
Spot CVD saw a landslide and speculators flip bearish
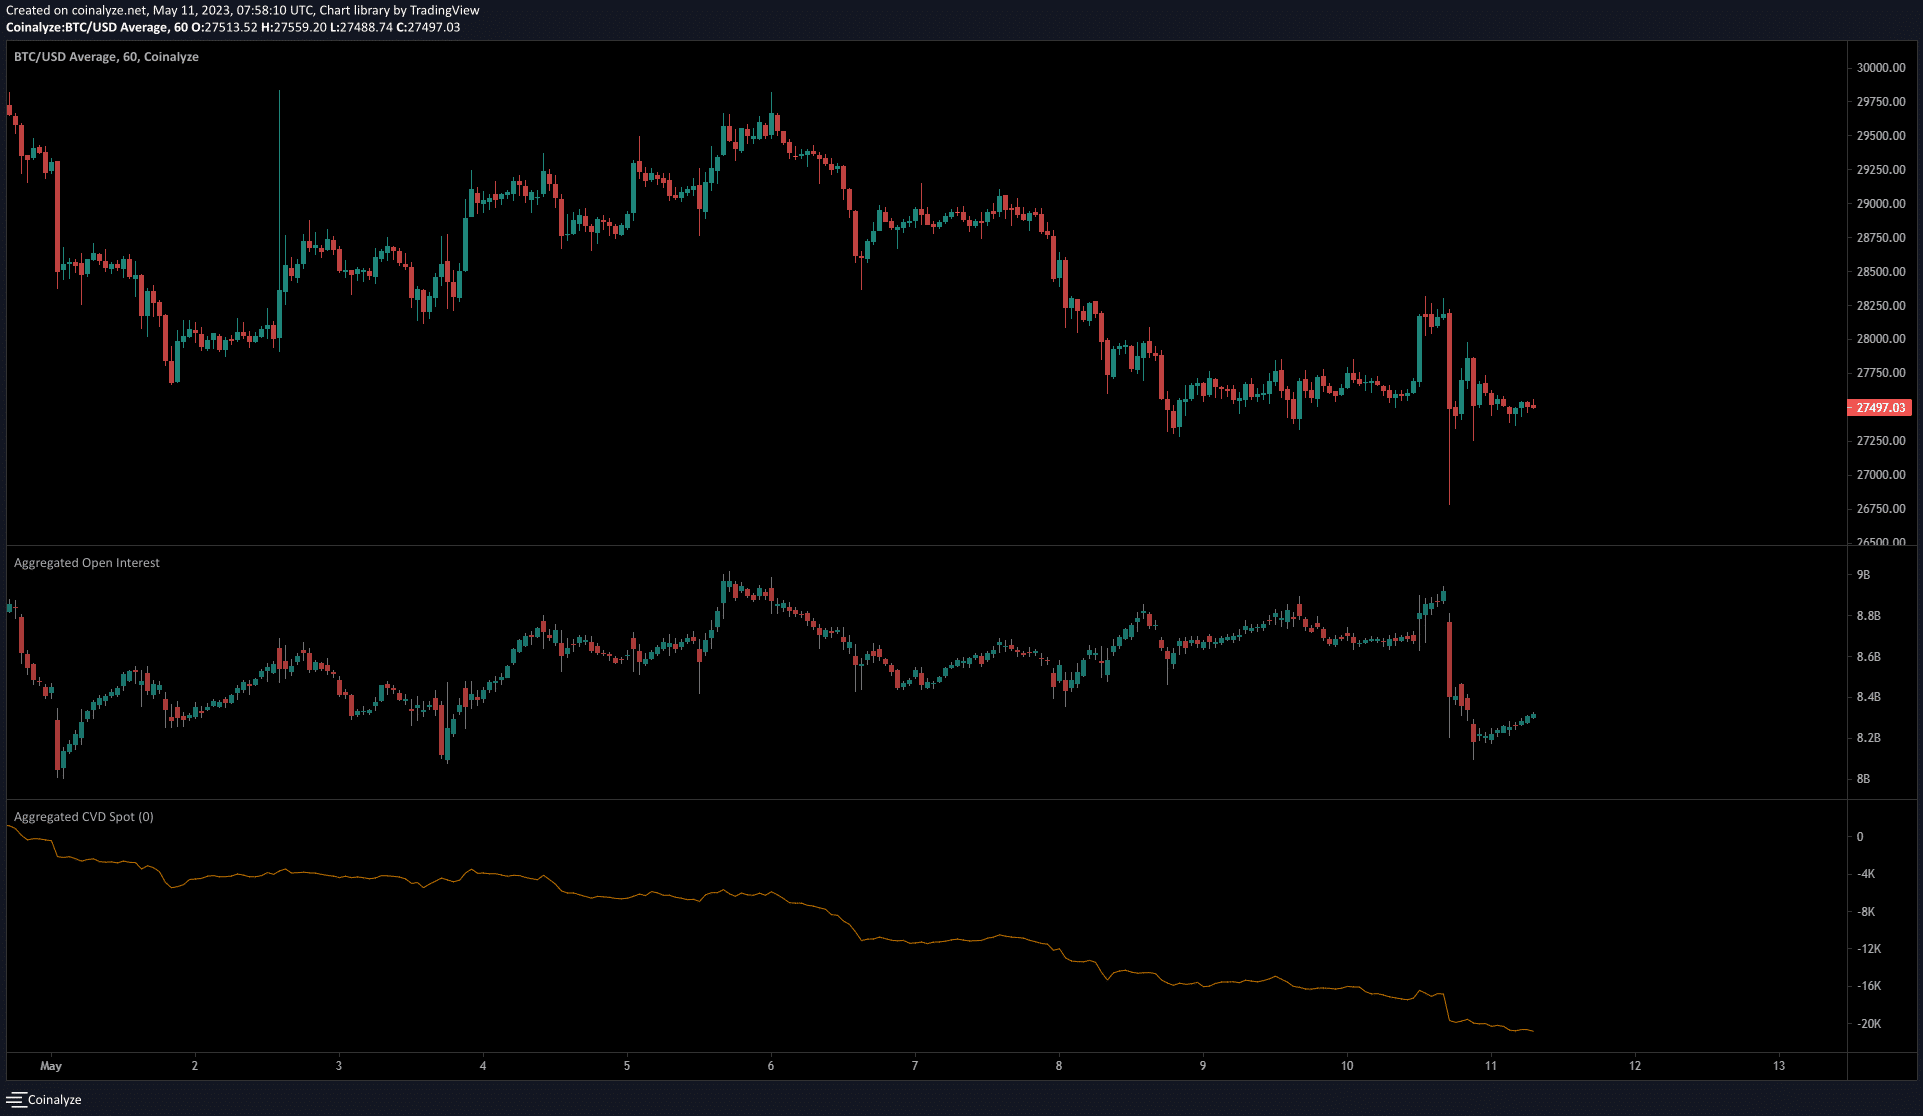
The 1-hour chart from Coinalyze showed that over the past 12 hours, Open Interest has been on the rise while the prices slowly fell from the $27.8k level after retesting it as resistance. This was a strong sign of bearish sentiment.
Is your portfolio green? Check the Bitcoin Profit Calculator
On top of this, the spot CVD was in a downtrend throughout May. Wednesday’s bounce above $27.8k saw a minor spike on the CVD.
The metric slid sharply downward after the subsequent selling pressure. The next level of support to watch out for is $26.8k, although $27.2k was significant over the past two days as well.


