Bitcoin witnesses pullback above $10,000 as bulls introduce themselves in the charts

Bitcoin was trading at $10,536 at press time showing a downward trend. The market cap was recorded to be around $190 billion and the trade volume registered was $1.7 billion.
1-Hour Price Chart
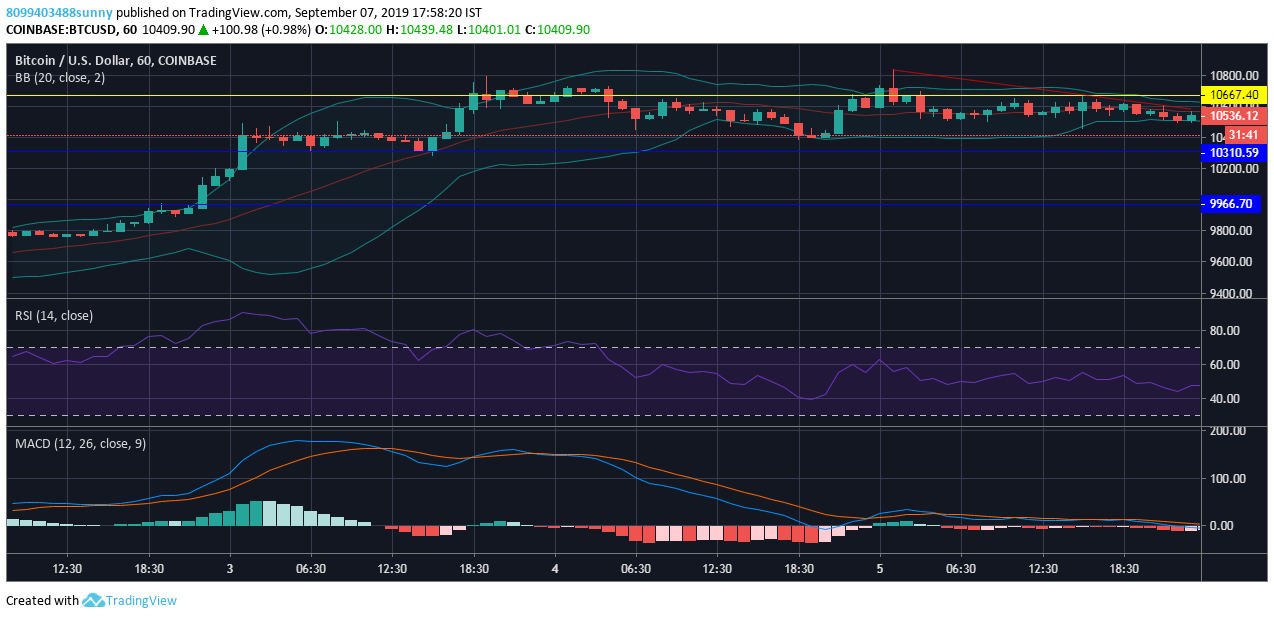
In the 1-hour price chart, Bitcoin is exhibiting a downward trend from $10,800 to $10,600 with the immediate support forming at $10,310.59 which if Bitcoin falls through, the next support is forming at $9966.70. Bitcoin needs to break through the resistance point of $10,667.70.
The Bollinger Band indicator showed the price volatility has been on a decline since 4th September showing minimal fluctuation in prices.
The RSI indicator suggested that Bitcoin was oversold between 3rd and 4h of September while the market remained neutral thereafter.
The MACD indicator showed bullish sentiments on 3rd September, however, bears were dominant on 4th September while the market was on the neutral side on 5th September.
1-Day Price Chart
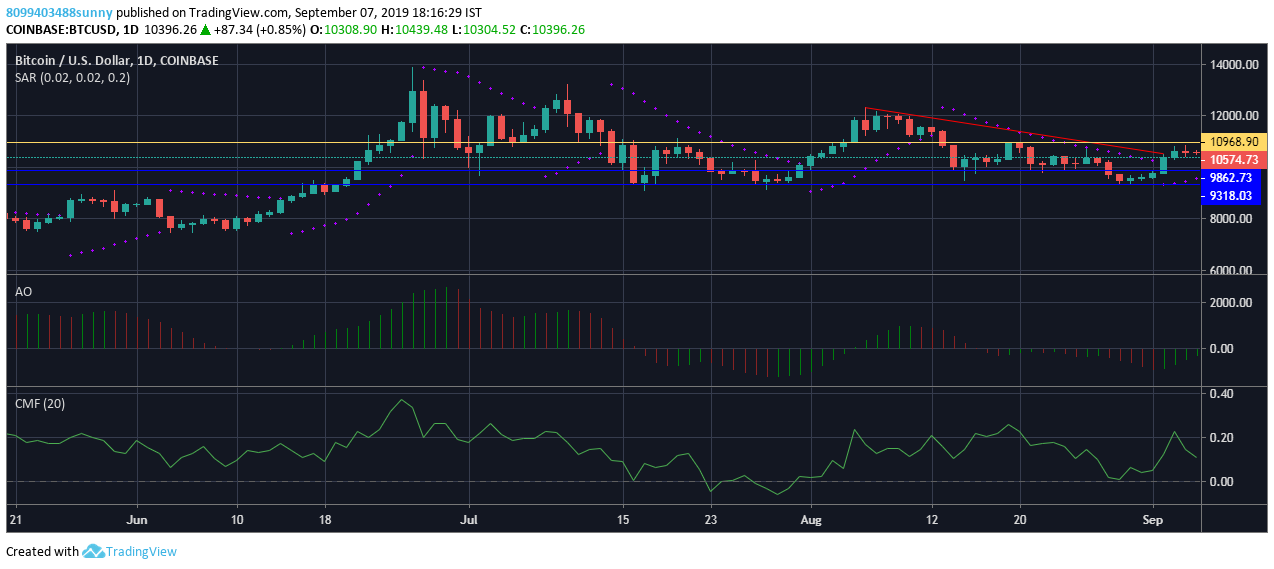
Looking at the one-day price chart, Bitcoin is forming immediate support at $9862.73, and if Bitcoin falls below that the next support will be forming at $9318.03. On the one-day price, chart Bitcoin is showing a downward trend from $12,342 to $10,583.
The Parabolic SAR Indicator showed that the markers are below the candle from 2nd September indicating bullish sentiments are high.
The Awesome Oscillator indicated that the market is fluctuating in the long term with minimal momentum, however, in the short term, it’s more on the bullish side.
The Chaikin Money Flow or CMF showed that the selling pressure is between 23 to 29 august while the money flow is neutral since then.
Conclusion
The price of Bitcoin consolidated up the charts after witnessing a bullish pullback at press time. The short-term and long-term indicators suggested bulls were back in the picture in the current trend.


